
Introduction
In today's digital age, data is often referred to as the "new oil." Organizations across the globe are increasingly recognizing the value of data as a critical asset that can drive innovation, efficiency, and competitive advantage. According to a recent study, companies that leverage data-driven insights are 23 times more likely to acquire customers, six times as likely to retain them, and 19 times as likely to be profitable. This blog aims to guide you through the transformative journey from raw data to actionable intelligence, highlighting key stages and best practices to harness the full potential of data within your organization.
Data is ubiquitous in any organization, flowing in from various sources such as customer interactions, sales transactions, social media, and operational processes. However, raw data in its unprocessed form is of little to no use; it is merely a collection of numbers and facts that lacks context and meaning. To transform this raw data into valuable insights, raw data has to go through several transformative phases. In this blog, we also discover these phases.
Understanding Raw Data
Raw data, also commonly known as primary data is the unprocessed information collected from various sources. Each functional organization collects large amounts of raw data from various sources, and data in this form, while being able to provide some intuition into operations, can skip many things.

Raw data comes in different forms:
- Unstructured Data: Unorganized data that doesn't fit into traditional databases, such as emails, videos, social media posts, and sensor data. Most data in this world is unstructured, and while being difficult to analyze, unstructured data can provide tremendous insights into an organization, that one would usually miss.
- Structured Data: Structured data is data with structure, this type of data fits in traditional databases, can be recorded in sheets, physical or digital, and can be worked with easily. Structured data while not being in volumes as much as unstructured data, has much more capabilities for analysis. Hence, it is extremely important for a company to build strong data foundations.
- Semistructured data: It can be argued that this falls under the category of structured data, but it doesn't fit entirely in it. Such data has some structure, but not enough to be represented in tables effortlessly. This includes JSON files and XML files.
Raw data has to be collected and integrated through many sources. These sources include:
- Internal Databases: The organization's database is one of the main sources of structured data
- Web Logs: Logs from websites can be analyzed.
- Analytics Platforms: Data can be collected from analytics platforms, such as Google Analytics and others to analyze the customer base
- Transaction Logs: The organization's transactions play an important role in understanding the organization's users, and the users ultimately make the organization
- External Devices: IOT devices can be excellent data collectors depending on your use case.
- Physical Methods to Store Data: Even at present in this digital world, data might exist in physical records in many places, while difficult to process, these physical forms of data can be eliminated by transforming operations digitally, and building strong data foundations along the way.
Data Collection and Integration
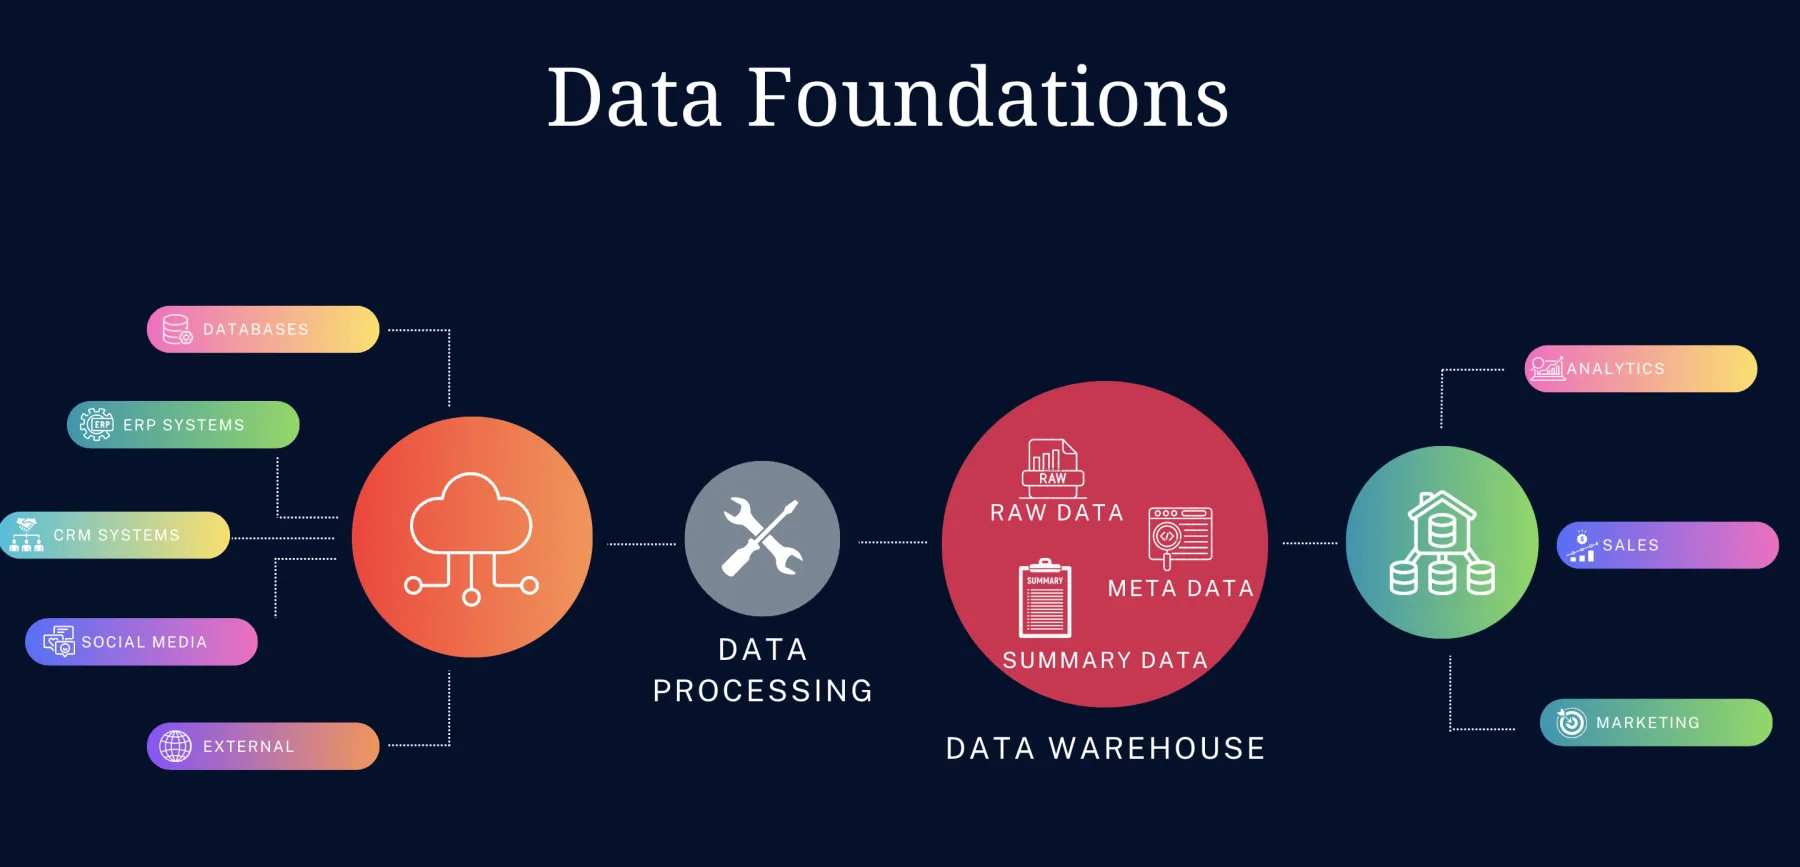
Data collection refers to collecting new data from users in various ways as per one's preference. Data integration refers to integrating various existing sources of data in one place, mostly called as the Data Warehouse.
Traditional data collection methods include storing data as records. As with the transition of the world into the digital era, excel sheets became the most common way of collecting structured and semi-structured data by organizations. While proving to be sufficient, it is no longer enough for an organization to survive in this rapidly evolving world that is backed by data. I can argue the challenges and limitations of storing data in Excel sheets.
Storing data in Excel sheets can present several challenges and limitations that can significantly impact efficiency, accuracy, and scalability. Here are some key issues that highlight why custom data collection software is often a far superior alternative:
- Scalability: Excel struggles with large datasets. As the volume of data increases, performance can degrade, leading to slow loading times and potential crashes. Custom software can handle vast amounts of data more effectively, designed specifically to scale with organizational needs
- Data Integrity and Accuracy: Excel is prone to human error, whether through accidental deletions, incorrect formulas, or inconsistent data entry. These mistakes can lead to unreliable analyses and conclusions. Custom data collection software can implement validation rules and automated checks to ensure data integrity and accuracy.
- Version Control: Excel sheets can get messy and unorganized, and hard to keep track of.
Data integration is the process of combining data from different sources to provide a unified view and facilitate analysis, reporting, and decision-making. This process is essential for organizations that deal with diverse data sets from various systems, applications, and formats, enabling them to derive meaningful insights and foster informed strategies.
The data integration process typically involves several key steps:
- Data Extraction: This is the initial phase where data is collected from various sources. These sources can include:
Databases: Relational databases like MySQL, Oracle, and PostgreSQL, as well as NoSQL databases like MongoDB and Cassandra.
Flat Files: CSV, Excel, and XML files, which often contain structured data.
Cloud Storage: Data residing in cloud platforms such as AWS, Azure, or Google Cloud can also be accessed for integration
- Data Transformation: Once extracted, the data often requires cleansing and formatting to ensure consistency and compatibility. This can involve removing duplicates, converting data types, and applying business rules to align the data with organizational standards.
- Data Loading: After transformation, the cleaned data is loaded into a target system, such as a data warehouse or a data lake, where it can be stored and accessed for further analysis
- Data Monitoring and Maintenance: Continuous monitoring is essential to ensure the integrity and accuracy of the integrated data. This includes regular updates and adjustments to the integration processes as new data sources are added or existing ones change.
After integration, data is effectively stored in warehouses, ready for analysis tasks.
Data Storage and Management
Once data is collected, it needs to be stored in a way that makes it accessible and secure. At the same time, the methods of storing data should be as such that it makes further analysis of it easy. While storing data, it is essential to establish production and analysis pipelines, which is tested for new incoming data, as well as data that that is flowing out. During this process, it is important to maintain the integrity of the data.
Data can be stored by organizations in different sources, collectively can be called a warehouse, or a data lake. Here, it consists of the organizations all present structured and unstructured data stored, and ready to be used for production and analysis pipelines.
Effective data management ensures that data remains accurate, accessible, and secure throughout its lifecycle, it includes:
- Data Governance: Establishing policies and procedures for data quality, privacy, and compliance.
- Data Security: Implementing measures to protect data from unauthorized access and breaches, including encryption and access controls.
- Data Compliance: Adhering to legal and regulatory requirements, such as GDPR and CCPA.
Data Processing and Transformation
With the above steps and infrastructure, we will have built a strong data foundation from which we can proceed into analysis, generate valuable insights, and enforce a culture of data-driven decision-making in an organization. Data processing and transformation is carried out so as to make the data transformation computationally efficient, more efficient meaning less time, less time means less cost, and also meaning decision-making capabilities in real-time.
Steps to data processing and transformation include:
Data Cleaning
Before data can be analyzed, it must be cleaned to ensure accuracy and reliability:
- Removing Duplicates: Identifying and eliminating duplicate records to prevent skewed analysis.
- Handling Missing Values: Addressing gaps in data by filling in missing values or discarding incomplete records.
- Standardizing Data: Ensuring consistency in data formats and units across different datasets.
Data Transformation
Transforming data into a suitable format for analysis involves several steps:
- Normalization: Organizing data to reduce redundancy and improve integrity.
- Aggregation: Summarizing data to provide a higher-level overview, such as total sales per month.
- Encoding: Converting categorical data into numerical formats for machine learning algorithms.
ETL Pipelines
ETL (Extract, Transform, Load) pipelines automate the process of moving and transforming data:
- Extract: Retrieving data from various sources.
- Transform: Cleaning and transforming data into the desired format.
- Load: Loading the processed data into storage solutions like data warehouses or lakes.
With the establishment of data processing and transformation pipelines, data can be extracted, processed, and transformed for analysis in real-time. With this, data can be prepared for suitable algorithms, and dashboards, that can be built in later stages.
Data Visualization and Analysis
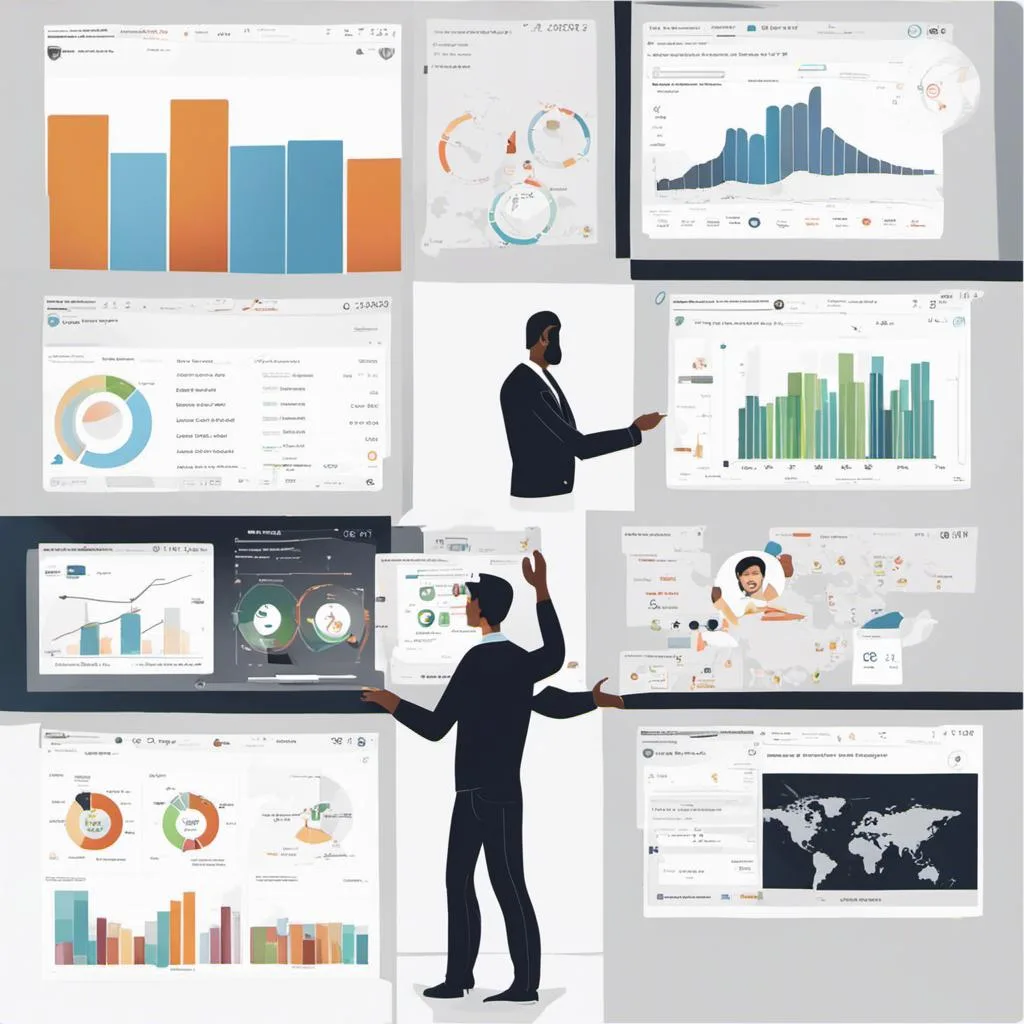
Data visualization is the graphical representation of information and data. By using visual elements like charts, graphs, and maps, data visualization tools provide an accessible way to see and understand trends, outliers, and patterns in data. The importance of data visuals lies in their ability to transform complex datasets into clear and intuitive representations, making it easier for stakeholders to grasp insights and make informed decisions.
Displaying these visuals through dashboards is crucial as dashboards aggregate various data visualizations into a single interface, allowing users to monitor key performance indicators (KPIs) and metrics in real time. This consolidated view enhances comprehension, enabling users to spot trends and anomalies quickly. Dashboards can be tailored to specific audiences, ensuring that decision-makers have immediate access to the information most relevant to their roles.
Custom dashboards displaying Key Performance Indicators (KPIs) are instrumental in data-driven decision making as they provide a clear, visual representation of vital metrics that influence business performance. By synthesizing complex data into easily understandable formats, these dashboards allow decision-makers to quickly grasp the current state of the organization. This immediacy enables them to identify trends, pinpoint areas needing attention, and assess the effectiveness of strategies in real time.
The importance of data-driven decision-making lies in its ability to minimize uncertainty and bias in the decision-making process. Relying on empirical data, rather than intuition or anecdotal evidence, organizations can make informed choices that enhance operational efficiency, improve customer satisfaction, and drive growth. This approach fosters a culture of accountability, as decisions are backed by measurable outcomes, leading to better resource allocation and strategic planning.
Dashboards can serve many purposes, some of them include:
- Executive Dashboards: These are high-level dashboards designed for senior management. They offer an overview of an organization’s performance, integrating strategic metrics that help executives make informed decisions quickly. They focus on critical data points and trends, allowing for agile responses to business challenges.
- Sales Dashboards: Tailored for sales teams, these dashboards track sales performance, pipeline metrics, and customer acquisition efforts. They visualize data related to revenue, sales targets, lead conversions, and team performance, enabling sales managers to optimize strategies and drive growth.
- Reporting Dashboards: These dashboards provide detailed reports on various operational activities, these are used primarily for reporting purposes.
- Analysis Dashboards: These dashboards focus on data analysis and visualization, enabling users to dive deep into specific metrics and trends. They often include advanced analytical tools and features such as predictive modeling and data mining.
Analysis with Machine Learning Algorithms
With strong data foundations built, means to visualize data, and get insights quickly from visualized data, we can now take the next step with such data by automating insights and decisions. Machine learning is the process of using algorithms to analyze data patterns, enabling systems to learn from data inputs and improve their performance over time without explicit programming. This capability allows organizations to predict future trends, optimize operations, and enhance decision-making processes.
According to the availability of data, two types of machine learning algorithms can be empowered in an organization, they are:
a. Supervised Learning
This includes data that is labeled. For supervised machine learning, transactional data can be used, and various other tabulated data that benefit from a prediction can be used.
- Predictive Modeling: Predictive modeling can be used to analyze trends and then predict wanted variables on the basis of those trends
- Recommender Systems: Though may be supervised or unsupervised techniques, data can be used to train powerful recommender systems increasing your churn.
- Automate various tedious business areas: This includes automating defaulting, churn prediction, etc which would usually require a person physically present.
b. Unsupervised Learning
Unsupervised learning is a machine learning technique that can be used to discover trends and patterns in data. This can be extremely useful for an organization to gain additional insights into its operations, its users or its products. It can be used for:
- Customer Segmentation: Separate customers into categories, according to their buying, and browsing habits, for better insights into customers, leading to a better conversion rate.
- Portfolio Optimization: View the performance of your products to better organize the portfolio to expect better conversions.
- Clustering and Segmentation: View different categories of your data for better insights
These algorithms can also be embedded directly into the website, while these machine learning algorithms have a complete life cycle in themselves, that is a topic for another blog, and will not be covered here.
In Conclusion
Transforming raw data into actionable intelligence is a journey that requires a strategic approach, robust infrastructure, and continuous efforts. By understanding and collecting raw data, effectively storing and managing it, processing and transforming it into meaningful formats, and finally, visualizing and analyzing it, organizations can unlock the true potential of their data.
Data-driven strategies lead to informed decision-making, improved customer satisfaction, and optimized business processes. By embracing the power of data, organizations can innovate, grow, and thrive in today’s data-centric world.
Harnessing data is not just a technical endeavor but a cultural shift towards valuing insights and intelligence derived from data. As you embark on this journey, remember that the key to success lies in building strong data foundations, fostering a culture of continuous improvement, and staying agile in the face of ever-evolving data landscapes.
If you want to harness the power of your data, unlock more potential with your data, visit Gott Data here to learn more about us:
Reach out to us at:
Visit our data foundations plan:
Follow us at: