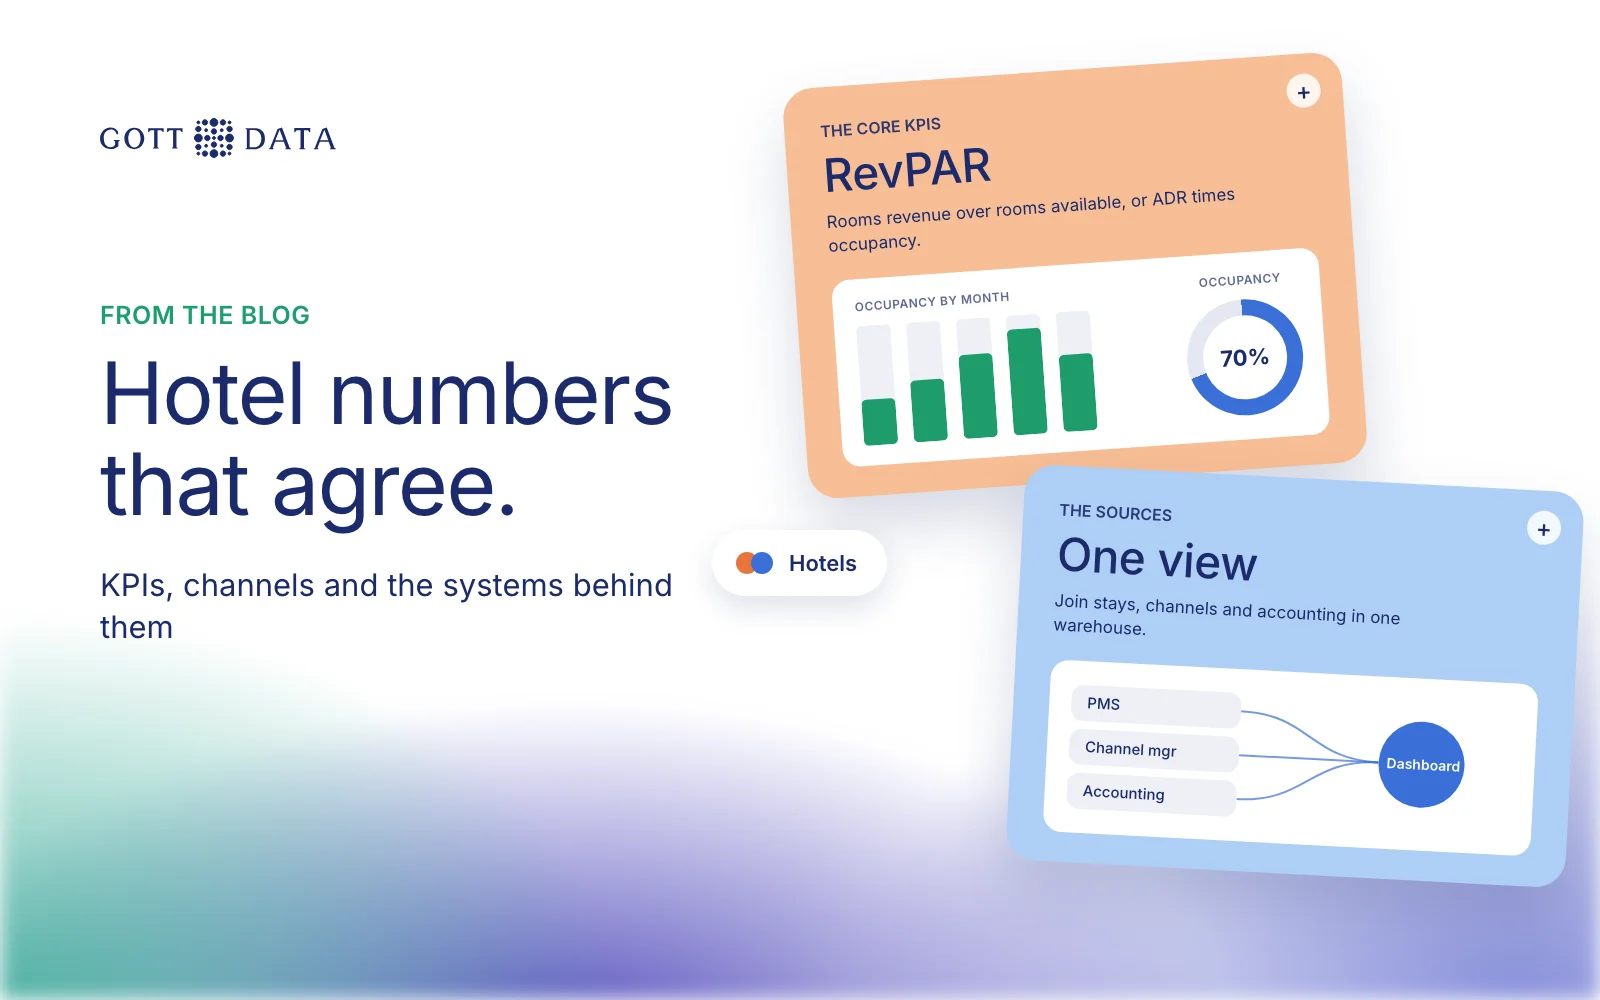
Hotel data analytics means answering a few questions reliably: how full were we, what did each room earn, which channels cost us the most, and what does next month look like? The numbers to do it already exist in your property management system (PMS), channel manager and accounting. The work is defining the KPIs correctly, joining the sources, and showing the result in one place. This post covers the core metrics, the channel view and how to connect the systems.
Which hotel KPIs matter most?
Three metrics do most of the work. Each is simple, but small differences in definition make hotels' numbers impossible to compare.
- Occupancy is rooms sold divided by rooms available.
- ADR (average daily rate) is rooms revenue divided by rooms sold. House-use and complimentary rooms are left out of the count.
- RevPAR (revenue per available room) is rooms revenue divided by rooms available. It also equals ADR multiplied by occupancy.
An illustrative example. A 100-room hotel over a 30-night month has 3,000 rooms available. It sells 2,100 room nights, so occupancy is 70%. Rooms revenue is ISK 42 million, so ADR is ISK 20,000. RevPAR is ISK 14,000, which is 20,000 × 70%.
Why RevPAR matters: you can raise occupancy by cutting prices, or raise ADR by turning guests away. RevPAR shows whether the trade was worth it. It is best compared across like periods, such as the same month last year.
Where do hotel numbers go wrong?
Most disagreements come from definitions nobody wrote down:
- Rooms available. Are rooms closed for renovation counted? Decide once.
- Rooms revenue. Gross or net of VAT? Breakfast included or split out? Commission deducted or not?
- Date. Revenue on the stay date, not the booking date, for occupancy and ADR.
- Cancellations and no-shows. Is a no-show fee rooms revenue?
- Currency. Bookings in euros and dollars converted at which rate, and on which day?
Write these rules down, apply them in one place, and every report after that agrees.
How do you measure channel mix and commission?
Hotels sell through several channels: the hotel's own website, OTAs, wholesalers, tour operators and direct calls or email. Each one brings a different price and a different cost.
Useful views for the channel question:
- Share of room nights by channel, month by month.
- Revenue after commission by channel, so a busy channel with high commission shows its real value.
- Direct booking share: bookings through your own website, phone and email as a share of the total.
- Lead time and cancellation rate by channel, because some channels book early and cancel often.
Commission rarely sits in the PMS in a clean form. It usually needs the channel contracts or invoices from accounting, joined to each booking. That join is where a data warehouse earns its keep.
Can you forecast demand?
Yes, if you have enough history. The simplest useful forecast is on the books: room nights already booked for each future date, compared with the same point last year. It shows early whether a month is pacing ahead or behind.
Beyond that, a model can combine pace, seasonality and booking lead time to estimate final occupancy. For a seasonal market like Iceland, you want at least two or three full years of history to see the pattern. Treat any forecast as a range, and check it against what actually happened.
How do you connect the PMS, channel manager and accounting?
The structure is the same in most hotels:
- PMS: reservations, stays, room types, rates and guest records. The core source.
- Channel manager: which channel each booking came from, and availability pushed to each.
- Accounting: invoices, commission paid, costs, and the closed monthly totals.
An ETL pipeline extracts from each on a schedule, maps room types and channel names to one list, converts currency, and loads the result into a warehouse. Checks compare room nights against the PMS and revenue against accounting for each closed month. Dashboards then sit on top, in Power BI, Qlik Sense or a custom view.
Guest records are personal data, so keep the warehouse in the EEA and limit who can see guest-level detail. Most reports only need totals by date, channel and room type.
Where should a hotel start?
Start with one dashboard: occupancy, ADR and RevPAR by month against last year, with a channel split. Connect the PMS first and accounting second. Add the channel manager and forecasting once people use the first view.
You can see how this looks in our hotel analytics demo. If you sell tours as well, tour operator data analytics covers the same approach for excursions. Our analytics work shows how we build it, and you can tell us which systems you use.