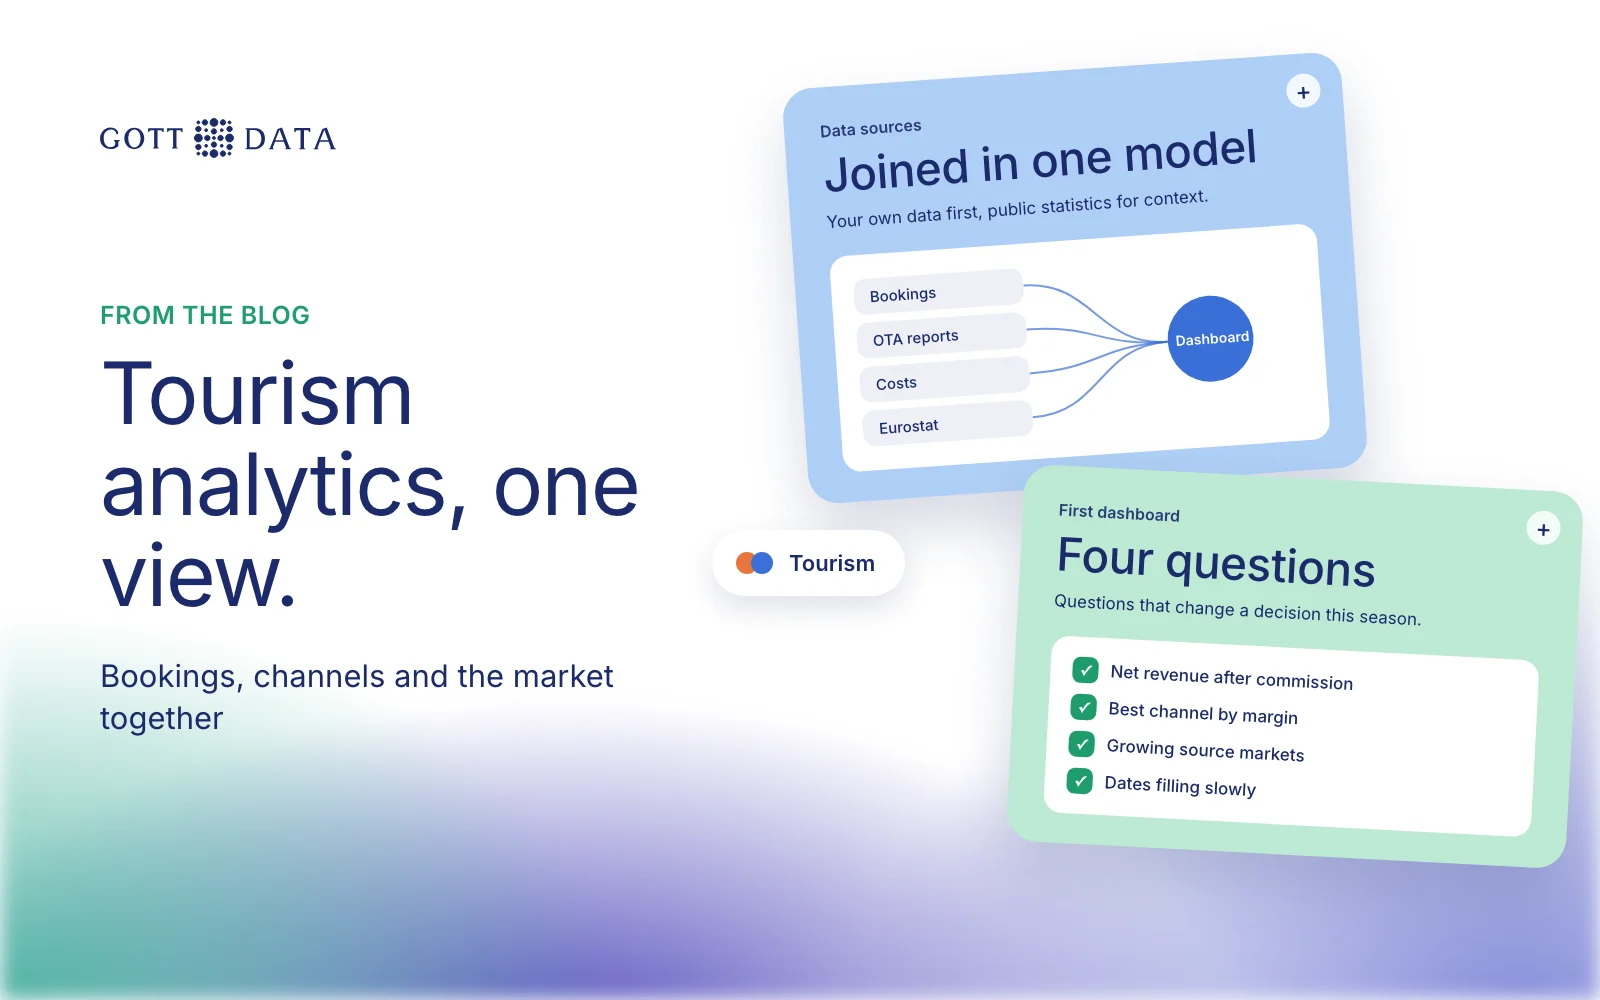
Tourism analytics means joining your own bookings with channel reports, costs and public statistics, so you can see demand, price and margin in one place. For a tour operator that means seats and commission. For a hotel it means occupancy and rate. For a destination it means visitor nights, markets and seasons. This post covers what each should measure, the data sources that feed it in Europe, and how to start.
What should tourism businesses measure?
The useful metrics differ by type of business. Five or six each is enough to begin.
Tour operators
- Net revenue per tour after reseller commission.
- Seat utilisation per departure.
- Channel mix: own website, OTAs, hotel desks, agents.
- Booking pace against the same date last year.
- Revenue by source market.
Hotels
- Occupancy, ADR and RevPAR.
- Share of direct bookings against OTA bookings.
- Pickup: how fast future dates are filling.
- Length of stay and lead time by market.
Destinations and tourism bodies
- Visitor nights by month, region and home country.
- Seasonality: how much of the year's demand falls in the peak months.
- Capacity: bed places and how full they are.
- Spending per visitor, where survey data exists.
Where does tourism data come from?
Most of the value sits in data you already own. Public statistics add the market view.
Your own systems
- The booking system or property management system: every booking, its dates, price, status and customer country.
- Accounting: guides, vehicles, fuel, staff and fixed costs.
- Your website analytics and ad accounts: visits, searches and cost per booking.
Channel data
- OTA and reseller reports, each with its own date rules, currency and commission terms.
- Agent and hotel desk statements, often by email or spreadsheet.
Public statistics
- Eurostat publishes tourism data for the EU, including the capacity and occupancy of tourist accommodation and trips made by EU residents. Its monthly figures on nights spent cover the 27 member states plus Iceland, Norway, Switzerland and Liechtenstein.
- UN Tourism keeps a Tourism Statistics Database gathered from countries and territories worldwide. It covers inbound, outbound and domestic tourism, accommodation and employment.
- National statistics offices go further. Statistics Iceland, for example, publishes monthly accommodation reports with visitors, overnight stays and occupied rooms. They can be split by region, type of accommodation and visitors' home country.
Eurostat counts a night spent as each night a guest actually stays in an accommodation establishment. Using the same definition in your own data makes the comparison fair.
How do you join it all up?
The hard part is not the charts. It is making the sources agree. A typical setup has three layers:
- Pipelines that pull bookings, channel reports, costs and public statistics on a schedule.
- A data model with one definition for each number: booking date or travel date, gross or net, how cancellations count.
- Dashboards that read only from that model.
We described this setup in detail in our post on tour operator data analytics. The same pattern works for hotels and destination bodies. Only the sources change.
What does it look like in practice?
TourDesk connects hotels with tours and excursions from many vendors. Its data sat in separate systems for hotels, vendors, suppliers, car rentals and restaurants. We joined those into one governed data foundation with automated ETL pipelines and Qlik Sense dashboards. Teams now track bookings, revenue, customer behaviour and regional market performance. Incremental loads keep reporting close to real time.
To see a tourism analytics dashboard without a project, open our tourism demo. It runs on a made-up Reykjavík tour operator with a year of realistic data. You can explore bookings by tour, channel and market, plus reseller commissions and invoicing.
Which questions should the first dashboard answer?
Start with questions that change a decision this season:
- Which tours or room types earn the most after commission?
- Which channel brings the best net revenue, not just the most bookings?
- Which source markets are growing compared with last year, and how does that compare with national figures?
- Which dates are filling slower than last year, so you can adjust price or ad spend in time?
Answer those well before adding forecasts or machine learning. Good history is what makes a forecast useful later.
If you work in tourism and want one view of bookings, channels and the market, see our analytics work or tell us what you track today.