Good KPI dashboard examples share one trait: five or six numbers a team acts on every week, each with one agreed definition and a clear data source. The right KPIs depend on the business. A tour operator watches seats and commission, a hotel watches occupancy and rate, a SaaS company watches recurring revenue and churn. Below are KPI dashboard examples for five business types, with why each KPI matters and the data you need to build it.
You can click through working versions of the first four in our live demo. It runs on made-up companies with a year of realistic data.
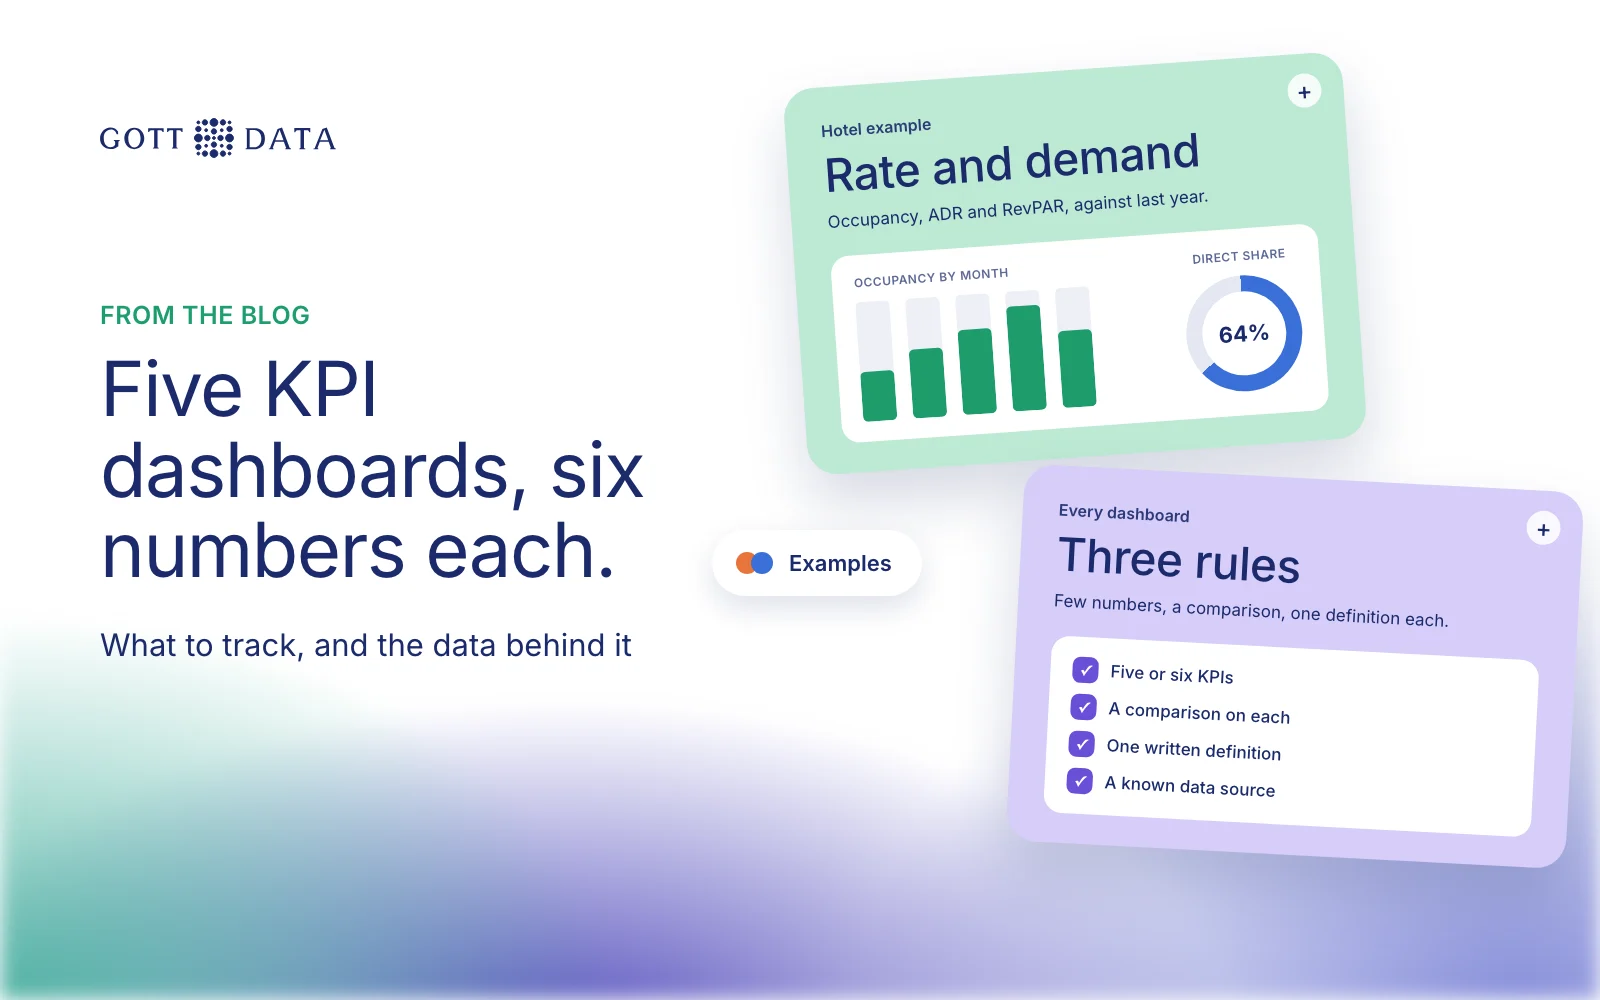
Three rules apply to every example below:
- Few numbers. Five or six KPIs on the first screen. Detail lives one click away.
- A comparison on every number. Last year, last month, target or budget. A number on its own says little.
- One definition each, written down. If sales and finance count "revenue" differently, the dashboard will start arguments, not end them.
The tool matters less. These examples work in Power BI, Qlik Sense, Tableau or a custom app. A spreadsheet can carry them for a while, though it struggles once several sources must refresh each day.
Example 1: tour operator
| KPI | Why it matters | Data needed |
|---|---|---|
| Net revenue after commission | Gross sales hide what resellers take | Bookings plus each channel's commission terms |
| Seat utilisation | Shows half-empty departures early | Seats sold and seats offered per departure |
| Channel mix | Shows where margin goes | Bookings by source: own site, OTAs, agents |
| Booking pace | Compares future bookings with last year | Bookings by booking date and travel date |
| Cancellation rate | Flags tours or channels with problems | Booking status history |
| Revenue by market | Guides ad spend by country | Customer country on each booking |
The hard part is joining the booking system with OTA reports and costs. Our post on tour operator data analytics covers that step. See it working in the tourism demo.
Example 2: hotel
| KPI | Why it matters | Data needed |
|---|---|---|
| Occupancy | Share of available rooms sold | Rooms sold and rooms available, from the PMS |
| ADR | Average revenue per occupied room | Room revenue and rooms sold |
| RevPAR | Combines rate and demand | Room revenue and rooms available |
| Direct booking share | Direct bookings avoid OTA commission | Booking source per reservation |
| Pickup and pace | How fast the season is filling | Reservations by booking date |
| Cost per occupied room | Keeps margin in view | Operating costs from accounting |
RevPAR is room revenue divided by available rooms, or ADR multiplied by occupancy. A high rate with many empty rooms still gives a weak RevPAR. The hotels demo shows direct and OTA bookings side by side.
Example 3: retail and ecommerce
| KPI | Why it matters | Data needed |
|---|---|---|
| Revenue and orders | The headline, against last year | Orders from the shop platform |
| Average order value | Shows whether bundles and pricing work | Order totals |
| Conversion rate | Share of visits that buy | Web analytics sessions and orders |
| Gross margin by product | Best sellers are not always best earners | Product cost prices |
| Return rate | Hidden cost in fashion and outdoor gear | Returns and refunds |
| Customer acquisition cost | Is paid growth worth it? | Ad spend by channel and new customers |
Margin is the KPI most often missing, because cost prices sit in a separate system. The retail demo breaks orders down by product, channel and market.
Example 4: B2B SaaS
| KPI | Why it matters | Data needed |
|---|---|---|
| Monthly recurring revenue | The core health number | Active subscriptions and prices |
| Net new MRR | New plus expansion, minus churn | Subscription changes by month |
| Customer churn rate | Share of customers who leave | Cancellations against customers at month start |
| Trial to paid conversion | Tests onboarding and pricing | Trial starts and first payments |
| Plan mix | Shows where customers settle | Plan per subscription |
| Revenue from partners | Shows if resellers pull their weight | Partner or referral tag per customer |
Billing systems hold most of this. Product usage data adds the early warning: accounts that stop logging in often cancel later. The SaaS demo shows subscriptions, trials and plan mix.
Example 5: public grants body
Public bodies need KPIs for transparency as much as for management.
- Grants issued by type, region and applicant group.
- Time to disbursement, from approval to payment.
- Amounts paid by category, against budget.
- Allocation by gender and other demographic groups, where policy asks for it.
- Open applications and how long they have waited.
This is close to what we built for KMÍ, an Icelandic government body, with Móholt. Data from several legacy systems went into one warehouse with Qlik Sense dashboards on top. Report generation went from days to minutes.
Where should you start?
Pick the three KPIs that come up in every management meeting. Write their definitions on one page. Find the system that holds each input. Build those three well before adding more.
If you want a KPI dashboard built on data you can trust, see our analytics work or tell us what you track today.