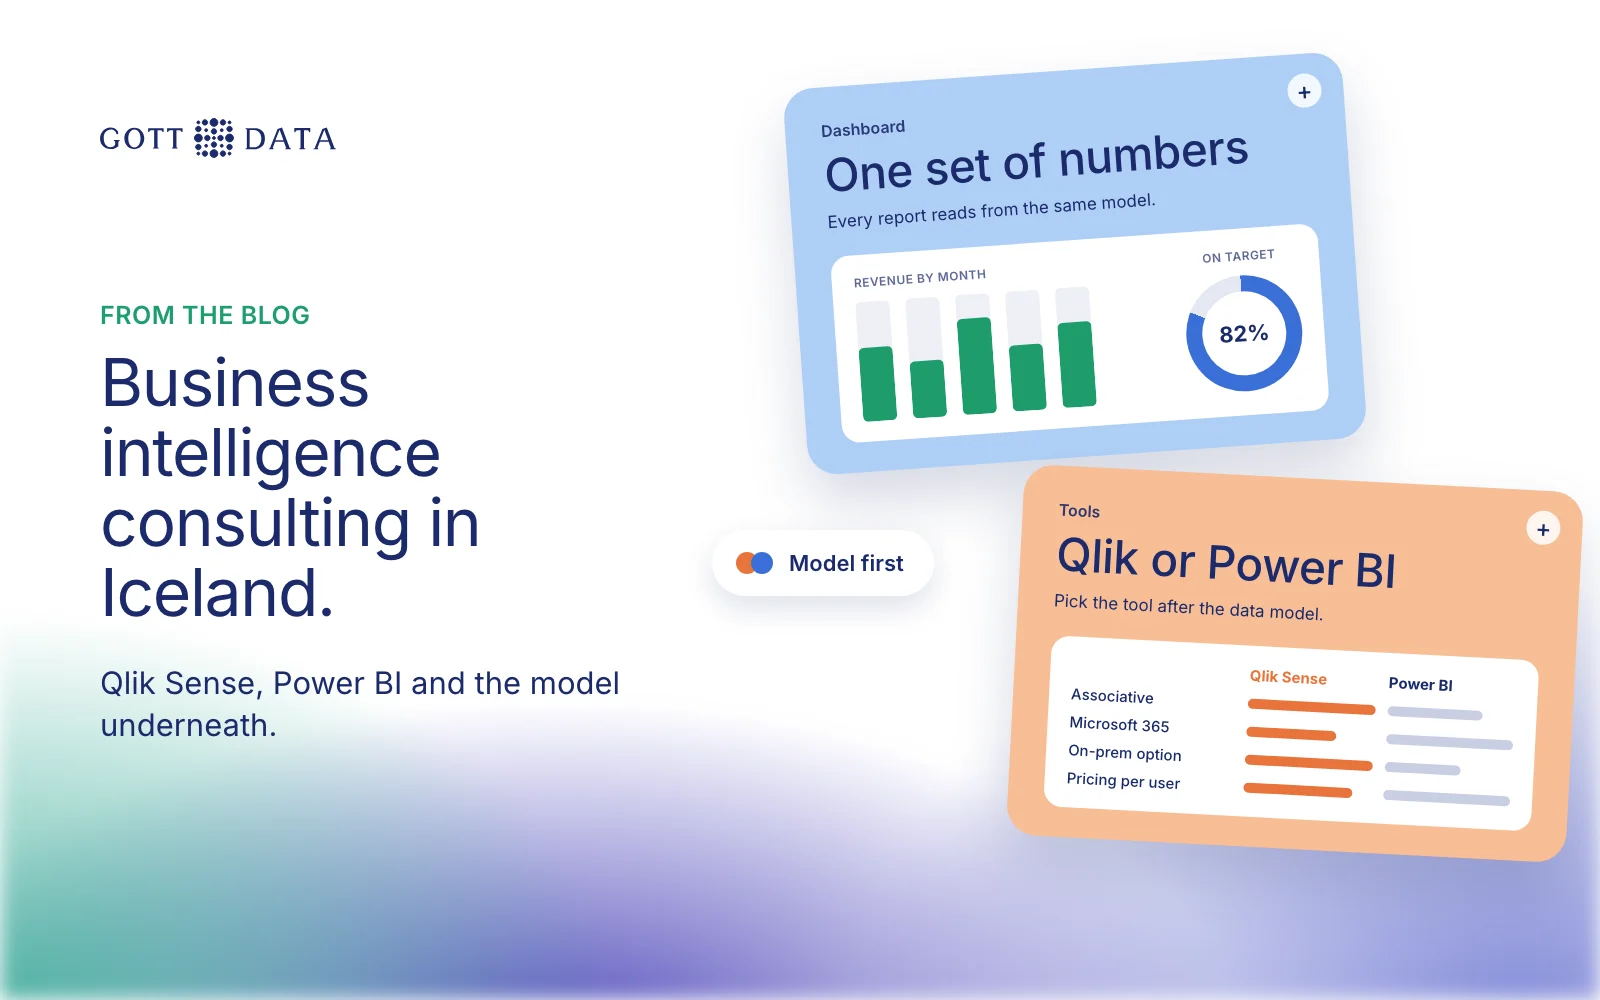
Business intelligence consulting in Iceland should start with the data model, not the dashboard. A good consultant first agrees what each number means and where it comes from, then builds reports in Qlik Sense or Power BI on top. Icelandic companies also need a few local details right: VAT rates, Icelandic characters, and accounting systems such as dk and Business Central. This post explains what the work covers and what to expect.
What does BI consulting actually include?
Most of the work happens before anyone sees a chart. A typical engagement has four parts:
- Sources. List every system that holds the numbers: accounting, sales, bookings, payroll, spreadsheets. Note who owns each one.
- Definitions. Agree what revenue, margin, a customer and an active project mean. Write them down.
- The data model. Load the sources into one place, apply the definitions, and check the result against the books.
- Dashboards. Build a small set of views that answer the questions people ask every week.
If you skip the first three, you get attractive dashboards that disagree with the accountant. Then nobody trusts them, and the team goes back to spreadsheets.
Why does the data model come first?
A dashboard is only as good as the table under it. When two reports read from two different extracts, they drift. One filters out credit notes, the other doesn't. One uses the invoice date, the other the payment date.
A shared model fixes this. Every report reads from the same tables, with the same rules. Change a definition once and every view follows. It also makes the choice of tool less risky. If the model is clean, moving from one BI tool to another later is a smaller job.
Qlik Sense or Power BI?
Both are good tools, and the right one depends on what you already use. Teams that live in Microsoft 365 often lean towards Power BI. Teams that want to explore data freely across many tables often like Qlik Sense. Licensing, hosting and who will maintain the reports matter as much as features.
We work in both, and we compare them in more detail in Qlik Sense vs Power BI. Our advice is to pick the tool after the model is sketched, not before.
What is different about BI in Iceland?
A few local details trip up projects that were planned elsewhere:
- VAT. Iceland has a standard VAT rate of 24% and a reduced rate of 11%. Sales and margin reports need to state clearly whether figures include VAT, and split lines by rate where that matters.
- Icelandic characters. Names and product descriptions use þ, ð, æ and ö. Exports in the wrong encoding turn them into garbage, and joins on names then fail quietly. Pipelines should test for this.
- Local accounting systems. dk is Icelandic business software with bookkeeping, invoicing and payroll. Microsoft Dynamics 365 Business Central has an Icelandic version with its own features for VAT reporting to the tax authority and for registration numbers. Each needs its own connector and mapping to a shared chart of accounts.
- Currency. A firm that sells in euros or dollars but reports in krónur has to convert. The model needs one agreed rule for which exchange rate applies to which date.
None of these is hard on its own. Together they are why a generic template rarely fits an Icelandic business without changes.
What does a real project look like?
Two of our projects show the pattern.
For KMÍ, an Icelandic government body that manages grants and reimbursements, data sat in several legacy systems and reporting was slow. Working with Móholt, we built a central data warehouse fed by automated ETL pipelines, with Qlik Sense dashboards for grants, reimbursements, policy and financial reporting. Report generation went from days to minutes.
For TourDesk, which connects hotels with tours from many vendors, data was split across hotels, vendors, suppliers and car rentals. We joined it into one governed data foundation, with incremental loads and Qlik Sense dashboards for bookings, revenue and regional performance.
In both cases the dashboards were the last step. The model came first.
How should you start?
A useful first phase usually takes a few weeks:
- Pick the one report that causes the most arguments today.
- Trace every number in it back to its source system.
- Agree the definitions with the people who use it.
- Rebuild it on a small, clean model and use it in the next monthly meeting.
Once that report is trusted, adding the next one is quicker, because the model and the rules are already there.
If you want reporting your whole team agrees on, our analytics work shows how we approach it, and you can tell us what you are working with.