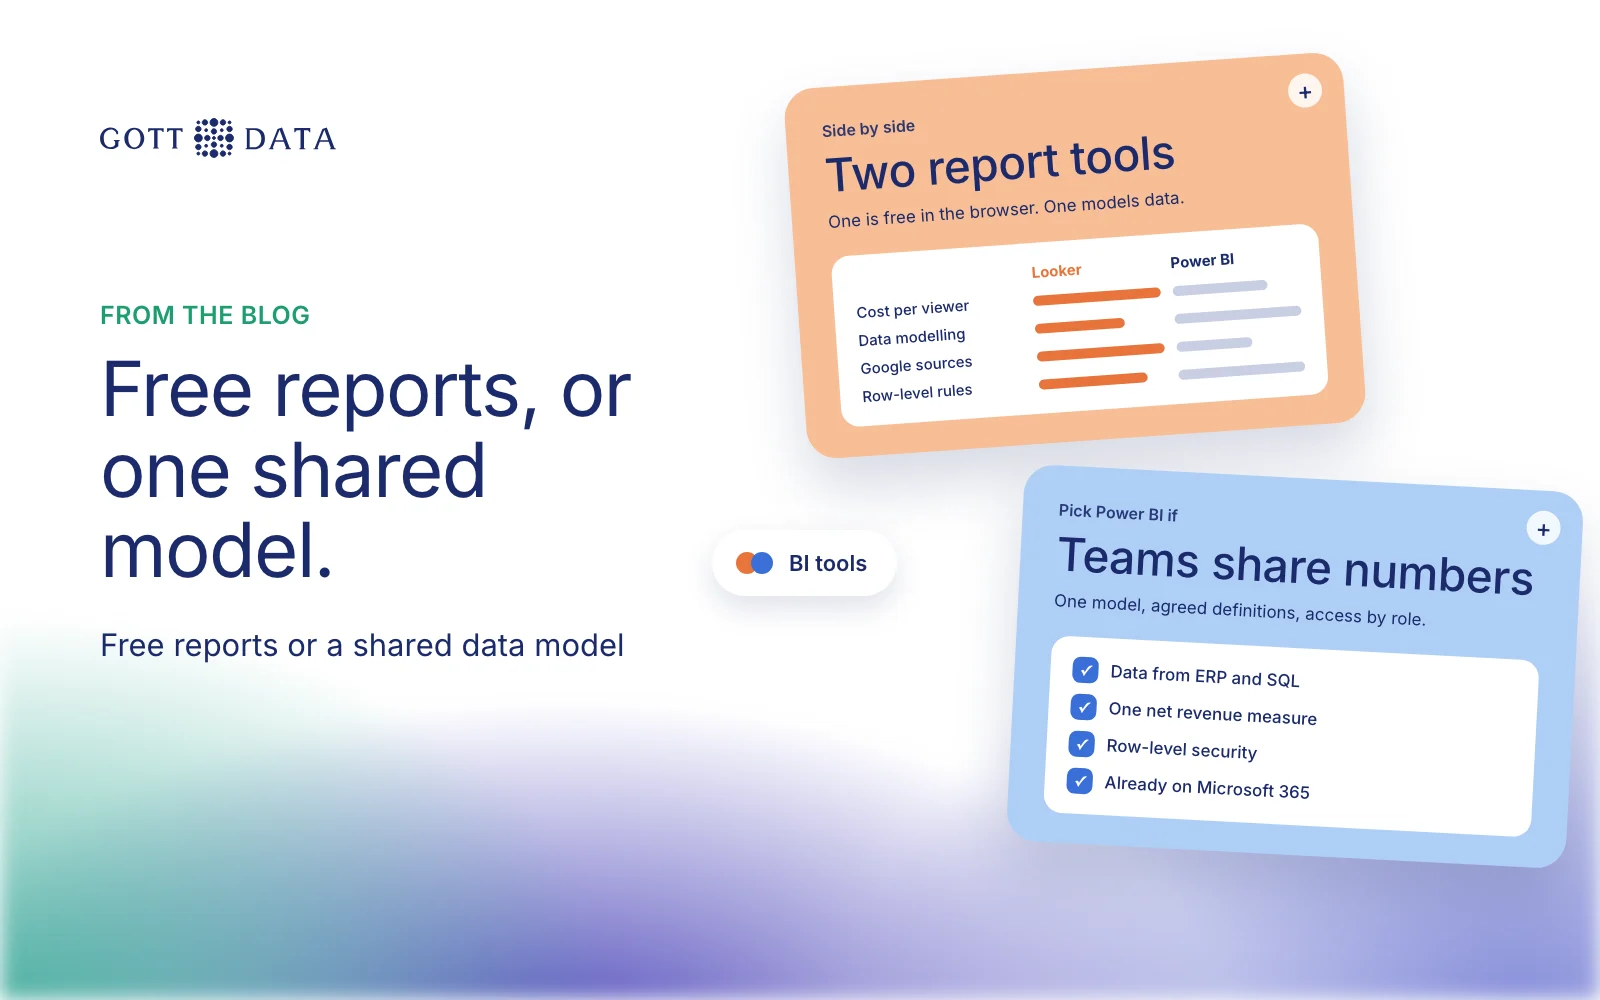
Looker Studio vs Power BI is mostly a choice between a free, browser-based report builder and a full BI platform with paid licences. Looker Studio is a no-cost Google tool that suits marketing reports built on Google data. Power BI is Microsoft's analytics platform, with data modelling, row-level security and governance, and it suits a company that wants one set of trusted numbers across teams. This post compares them on cost, data sources, sharing and governance for a small or mid-sized company.
One naming note. Google's current documentation calls the product Data Studio, its original name, while most people still search for Looker Studio. They are the same tool.
What is the difference between Looker Studio and Power BI?
Looker Studio runs in the browser. You connect a data source, drag charts onto a page and share the report. Most data sources keep a live connection to the underlying data. Modelling is light: each chart reads from its data source.
Power BI has two main parts. Power BI Desktop is a Windows app where you build data models with relationships and DAX calculations, then design reports. The Power BI service in the browser is where you publish, share and schedule refreshes. Power BI is also a core part of Microsoft Fabric.
| Looker Studio | Power BI | |
|---|---|---|
| Core tool | No cost | Free for personal use; paid licences to share |
| Paid tier | Pro, per licence | Pro, Premium Per User, or Fabric capacity |
| Where you build | Browser | Windows desktop app, plus browser |
| Data modelling | Light | Relationships, DAX, composite models |
| Strongest sources | Google Sheets, Ads, Analytics, BigQuery | Excel, SQL Server, Microsoft 365, Fabric, 100+ sources |
| Row-level security | Through data credentials | Built-in RLS roles |
How much do Looker Studio and Power BI cost?
Prices are as of November 2026, from the official pages, and vary by region and currency.
Looker Studio is free to use. Google's Pro subscription adds organisation-owned content, team workspaces and project-level permissions. Self-service Pro subscriptions are billed monthly per licence, whether or not each licence is used. Check Google's pricing page for the current rate.
Power BI has a free licence for building reports for your own use. To share, Microsoft lists Power BI Pro at $14.00 per user per month and Premium Per User at $24.00, both billed yearly. Larger organisations can buy Fabric capacity instead. Microsoft notes that the prices shown may not match the final list price in your country.
The sharing rules drive the real cost. With Power BI Pro, the people who view a report also need Pro, unless the content sits in a Premium capacity or a Fabric capacity of F64 or larger. With Looker Studio, viewers can open a shared report at no cost.
Which connects to more data sources?
Both connect to the common sources an SME uses. The difference is the home ground.
Looker Studio's free Google connectors cover Google Sheets, Google Ads, Google Analytics and other Google products. Partner connectors reach other systems, but Google warns that they "may cost money to use", and support comes from the partner.
Power BI Desktop connects to more than 100 sources through Power Query, including databases, files and cloud services. Power Query also lets you clean and reshape data before it reaches the report, which Looker Studio does not do in the same depth.
If your data lives in Google Ads and Analytics, Looker Studio is quick. If it lives in Excel, accounting systems and SQL databases, Power BI is the more natural fit.
How do sharing and governance compare?
Looker Studio lets you share reports "with your team or with the world", in Google's words. Data access depends on credentials. With owner's credentials, viewers see data through the report owner's access. With viewer's credentials, each viewer needs their own access to the data. In the free version, content belongs to the person who made it. Pro moves ownership to the organisation through a Google Cloud project, which matters when someone leaves.
Power BI uses workspaces, apps and roles. It includes row-level security, sensitivity labels, usage metrics and audit logs. You can define a measure such as "net revenue" once in a shared model and reuse it in every report. That is the main reason finance and operations teams pick it.
Which should an SME choose?
Choose Looker Studio when:
- Your main sources are Google Ads, Analytics, Search Console and Sheets.
- You need client or marketing reports shared widely at no licence cost.
- A few people build reports and the logic is simple.
Choose Power BI when:
- You need one data model with agreed definitions across teams.
- Data comes from accounting, ERP, SQL databases and Excel.
- You need row-level security, refresh schedules and an audit trail.
- You already pay for Microsoft 365 and work in its tools.
Many companies end up with both: Looker Studio for marketing, Power BI for the management numbers. That is fine if both read from the same cleaned data. If Qlik is also on your list, our Qlik Sense vs Power BI comparison covers that choice.
We build dashboards in Power BI and Qlik Sense on top of a clean data foundation. See our analytics work, or tell us what you report on today.