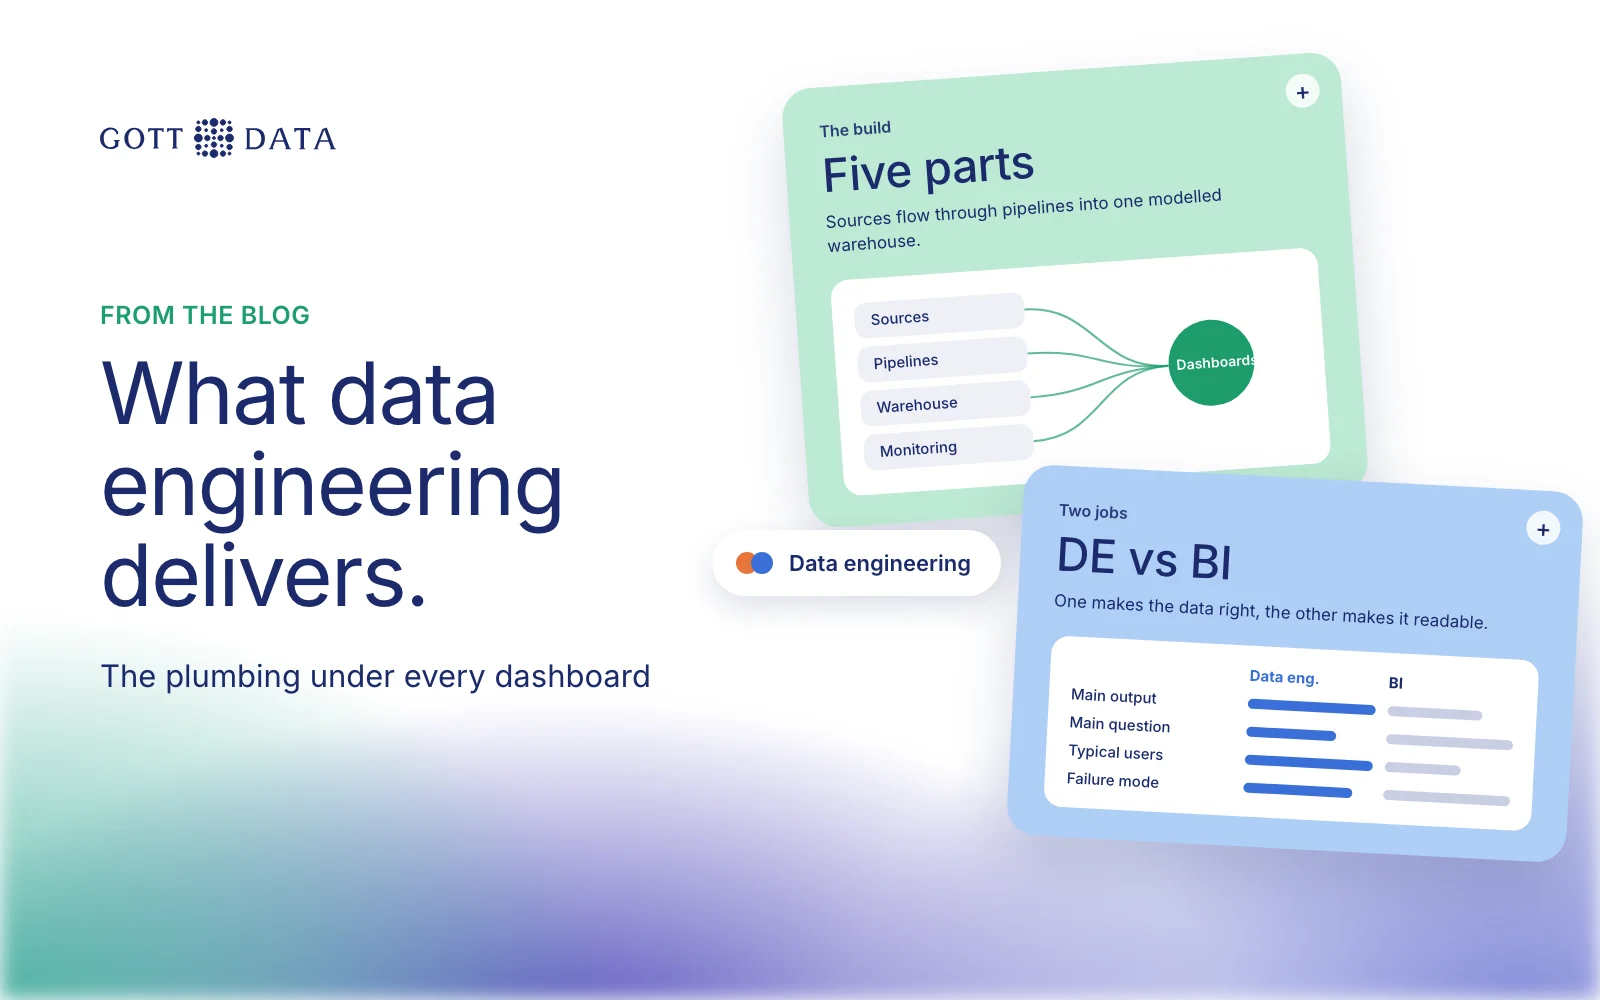
Data engineering consulting builds the plumbing that every report and model depends on. A good engagement leaves you with pipelines that pull data from your systems, a warehouse that stores it in one agreed shape, a schedule that runs it, monitoring that tells you when it breaks, and a running cost you understand. Dashboards come after. This post explains what each part involves, how it differs from BI consulting, and what three of our projects looked like.
What does data engineering consulting deliver?
Five things, in roughly this order:
- Pipelines. Code or tools that extract data from source systems such as booking engines, ERPs, CRMs, spreadsheets and APIs, then clean it and load it. Each source gets its own connector and its own rules for handling bad rows.
- A warehouse. One place where the data lives, modelled around the business: customers, orders, products, dates. This is where definitions get fixed, such as what counts as revenue or when a booking is "confirmed".
- Orchestration. A scheduler that runs the pipelines in the right order, retries failures and loads only what changed, rather than everything every night.
- Monitoring. Checks for missing loads, row counts that drop suddenly, duplicates and late data, with alerts to a named person.
- Cost control. A clear view of what storage, compute and tools cost each month, and choices that keep it in proportion to the value.
Documentation and handover sit across all five. If your own team can't run it after the consultants leave, the job isn't finished.
How is it different from analytics or BI consulting?
They overlap, but the focus differs.
| Data engineering | Analytics / BI | |
|---|---|---|
| Main output | Pipelines and a warehouse | Dashboards, reports and analysis |
| Main question | Is the data complete, correct and on time? | What does the data tell us? |
| Typical users | Engineers and analysts | Managers and teams |
| Failure looks like | A load that silently stops | A chart nobody trusts |
Most "the dashboard is wrong" problems are really data engineering problems. Two systems define a customer differently, or a load failed on Tuesday and nobody noticed. Fixing the chart doesn't help. Fixing the pipeline does.
That's why we treat them as one job. The same team that builds the warehouse builds the dashboards on top, so definitions stay consistent end to end.
What does it look like in practice?
TourDesk: many sources, one foundation. TourDesk connects hotels with tours and excursions from many vendors. Its data sat in separate systems for hotels, vendors, suppliers, car rentals and restaurants. We built automated ETL pipelines with Qlik Sense Data Integration, standardised formats and quality, and used incremental loads to keep reporting close to real time. Qlik Sense dashboards track bookings, revenue and regional market performance. See the TourDesk case study.
KMÍ: legacy systems into a warehouse. With our partner Móholt, we worked for an Icelandic government entity that manages grants and reimbursements. Its data was spread across several legacy systems with inconsistent formats. We migrated the history into a central warehouse, set up automated pipelines with validation and monitoring, and modelled it for Qlik Sense. The case study reports that report generation went from days to minutes. Read the KMÍ case study.
Quantile: the pipeline as visible files. Quantile is our own chat-first analytics workbench. You ask a question in plain English and it writes an extract, load, transform and visualise pipeline. Extraction is a generated Python script, the load lands in DuckDB, transforms are SQL files, and the dashboard is a spec. Every stage is a real file you can read and edit. It reflects how we think pipelines should work: inspectable, not hidden. See Quantile.
What should you ask a data engineering consulting firm?
- Which sources have you connected before, and how did you handle the messy ones?
- Where will the data live, and why that platform rather than another?
- How will we know a load failed? Ask to see an alert, not just hear about one.
- What will it cost to run each month, separate from the build?
- Who owns the code afterwards? It should sit in your repository, under your accounts.
A good answer to the last two matters more than any tool name.
When is it worth doing?
When people spend hours each week copying data between spreadsheets. When two reports give two numbers for the same thing. When you want machine learning but can't get a clean history out of your systems. Each of these is a sign the plumbing comes first.
Start small: one or two sources, one warehouse model, one report people use. Each new source after that is a smaller job.
If that sounds like your situation, our analytics work shows how we build data foundations, and you can tell us what you're working with.