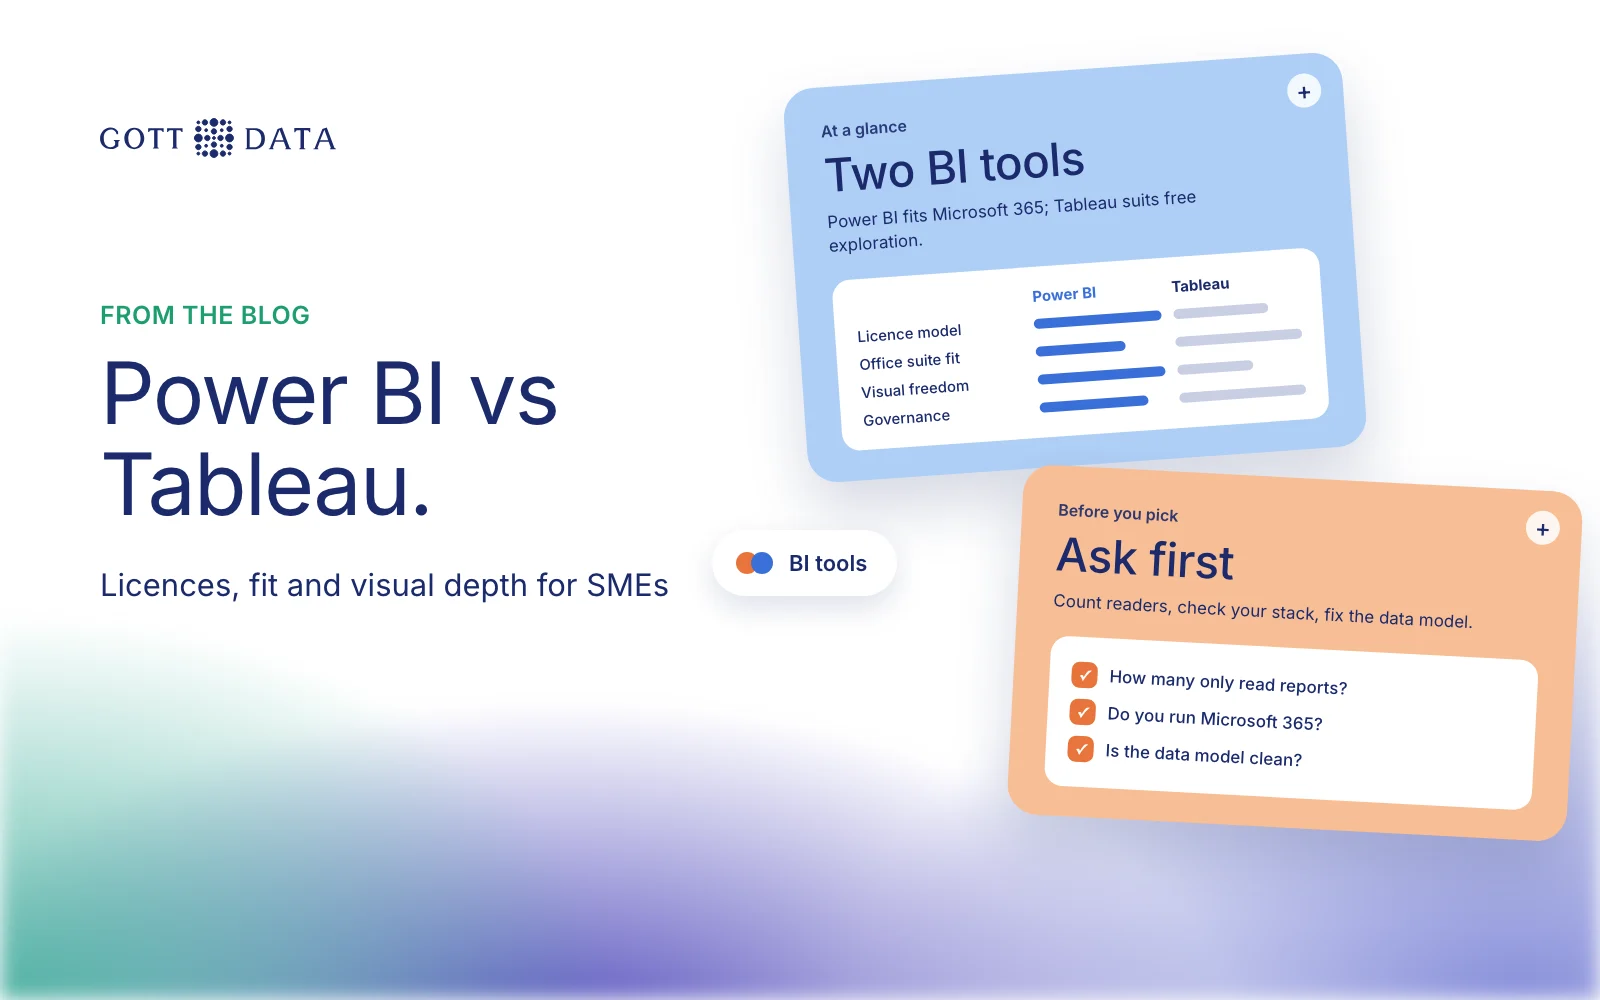
Power BI vs Tableau comes down to three questions for most European SMEs. Do you already run Microsoft 365? How many people only need to read reports? And how much visual freedom do your analysts want? Power BI is usually cheaper per seat and fits a Microsoft shop. Tableau gives analysts more room to explore and is not tied to one vendor's stack. Both are mature, and both will handle the reporting a small or mid-sized company needs.
How do Power BI and Tableau compare at a glance?
| Power BI | Tableau | |
|---|---|---|
| Authoring tool | Power BI Desktop (free, Windows) or the web | Tableau authoring with a Creator licence |
| Licence model | Per user (Pro, Premium Per User) or Fabric capacity | Per user roles: Creator, Explorer, Viewer |
| Read-only users | Need Pro, unless content sits on F64 capacity or larger | Viewer licence, or capacity-based Viewer Blocks on Enterprise |
| Best fit | Microsoft 365 and Azure shops | Teams that want deep visual exploration |
What does each one cost?
As of November 2026, Microsoft's pricing page lists Power BI Pro at $14 per user per month and Premium Per User at $24, both paid yearly. Pro is included in Microsoft 365 E5 and Office 365 E5. Power BI Desktop is a free download, and a free account lets you build reports, but you need Pro or Premium to share them. Prices vary by region and currency, so check the page for your country.
Tableau sells three roles. Creators can connect to data and publish. Explorers work with published content but can't create new data sources. Viewers can see content and comment. Tableau's pricing page lists the current rates per role and edition; we couldn't load it today, so we haven't quoted figures here. Check it, or ask a reseller, before you budget.
The pattern that matters is the split between authors and readers. Most SMEs have a handful of people who build reports and many who only read them. In Power BI, each reader on Pro workspaces needs a Pro licence. On a Fabric capacity of F64 or larger, readers with a free licence and a viewer role can open Power BI content. Below F64, they still need Pro. Tableau prices readers through the Viewer role, and from July 2026 Tableau Enterprise customers can buy capacity-based Viewer Blocks instead, which are sized by concurrent use rather than named users.
How well does each fit Microsoft 365?
This is Power BI's strongest card. It sits inside Microsoft Fabric, so reports, semantic models and data share one tenant with Teams, Excel and SharePoint. Your users sign in with the accounts they already have, and admins manage access with the same identity tools.
Tableau can read from Microsoft data sources too. It just lives outside that tenant, with its own sites, users and admin. For a company on Google Workspace or a mixed stack, that independence can be a plus.
One practical note: Power BI Desktop runs on Windows. Microsoft's minimum requirement is Windows 10 or Windows Server 2016. If your analysts use Macs, plan for the web editor or a Windows machine.
Which one gives more visual depth?
Tableau's reputation rests on free-form exploration. Analysts build a view by dragging fields around and change it as they think, which suits people who don't yet know the question.
Power BI is strongest at structured, repeatable reporting on a well-built model. Its formula language, DAX, handles measures such as year-on-year growth or margin after commission. Extra visuals come from AppSource, and admins can approve the ones their organisation may use. Microsoft itself warns that a custom visual can carry security or privacy risks, so check the author first.
In practice, the data model decides more than the charting. A clean model makes either tool quick, and a messy one makes both slow.
How do governance and security compare?
Power BI inherits Microsoft's governance through Fabric: workspace roles, sensitivity labels and Microsoft Purview. Tableau controls access through site roles and permissions, and Tableau Enterprise adds Data Management and Advanced Management for content, security and scale on Tableau Cloud.
For an SME, the question is simpler. Who owns the data model, and who may publish? Write that down first. Either tool can enforce it.
So which should you choose?
- Pick Power BI if you run Microsoft 365, want a low price per seat, and mostly need standard reports for many readers.
- Pick Tableau if your analysts do open-ended exploration, or you want BI kept separate from your office suite.
- Pick neither yet if your data lives in five systems that don't agree. Fix the warehouse first. The tool choice gets easier once the numbers match.
People also ask about Excel and SQL. Excel is fine for one-off analysis but hard to govern at scale. SQL is not a rival to either tool. It is how the data gets shaped before any dashboard sees it.
We build dashboards in Power BI and Qlik Sense, and our Qlik Sense vs Power BI comparison covers the other common choice. If you want help picking, our analytics work shows how we start.