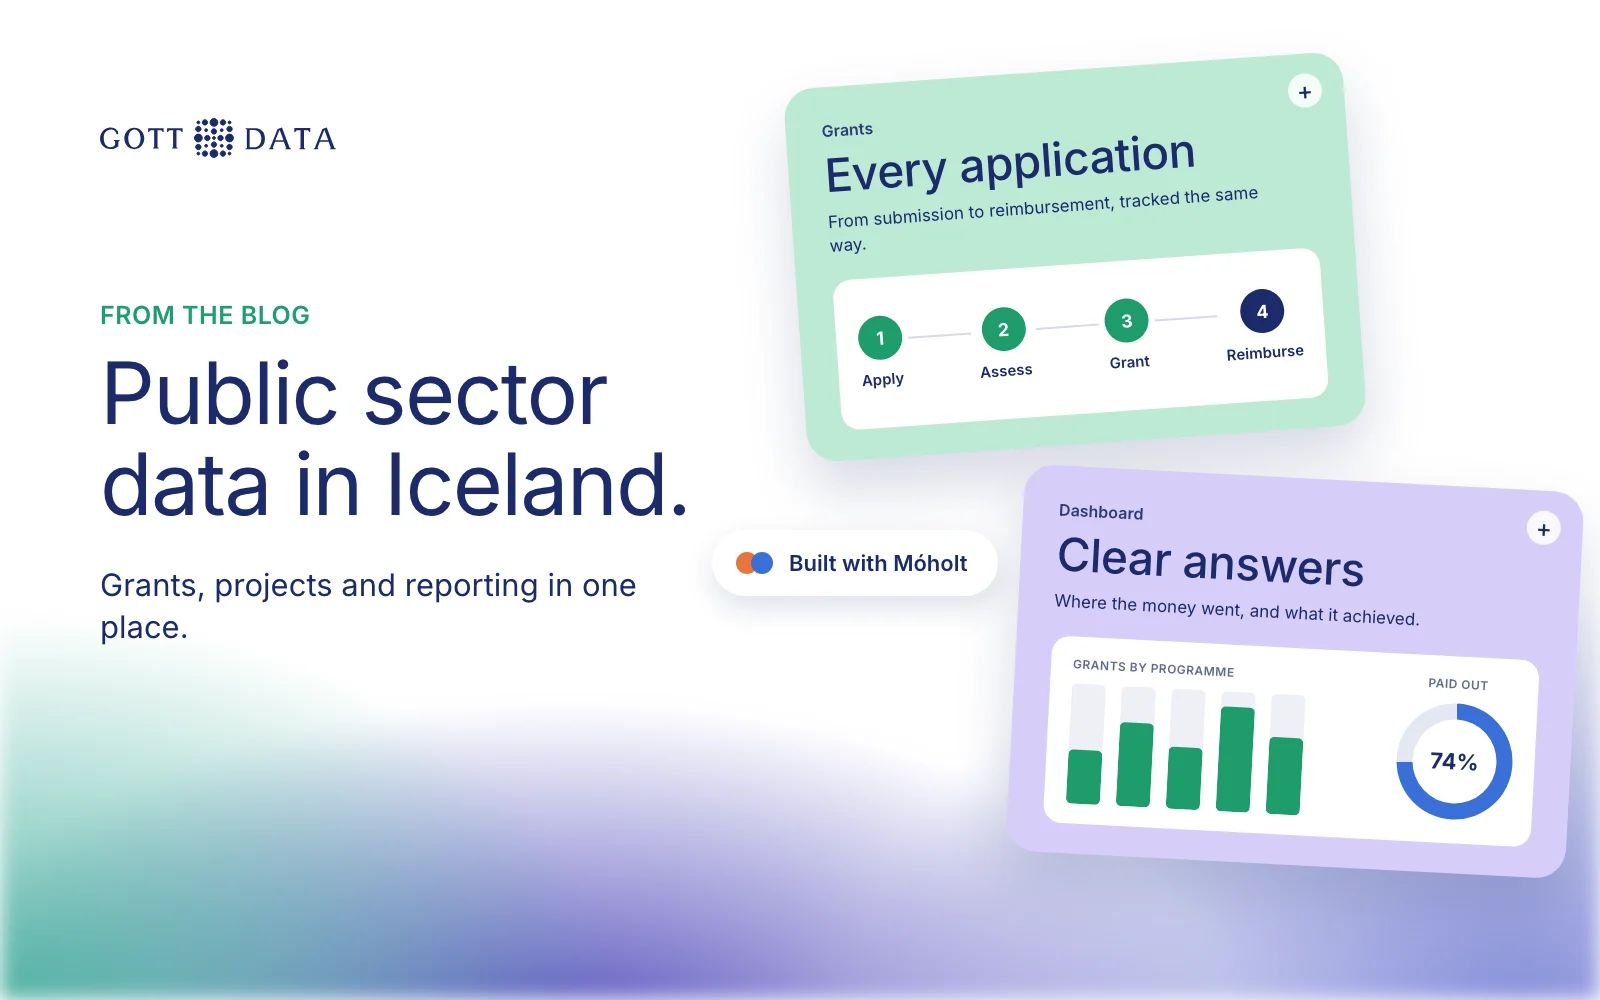
Public sector data in Iceland is often spread across old systems, spreadsheets and email, which makes simple questions slow to answer. How much did each programme grant this year? How long do reimbursements take? Where did the money go by region? The fix is a central data warehouse, a platform for entering and tracking projects, and dashboards with clear access rules. This post explains how that fits together, using our work for KMÍ with Móholt.
Why is public sector reporting so slow?
Most public bodies did not choose to have scattered data. Systems were added one at a time, each for a specific job. Grant applications live in one place, payments in the accounting system, and project status in someone's spreadsheet.
So every report becomes a small project. Someone exports files, matches them by hand, and checks totals against the books. When a minister, an auditor or a journalist asks a new question, the process starts again. The numbers are rarely wrong on purpose. They are just hard to reproduce.
What does a reliable setup look like?
Three parts work together:
- A data warehouse. One database where grants, reimbursements, projects and reference data are stored the same way, loaded by automated pipelines from each source.
- A project platform. A simple application where staff enter and update projects and grants directly, so new data arrives clean instead of in spreadsheets.
- Dashboards. Reports built on the warehouse, in a tool such as Qlik Sense, that answer the questions asked every month.
The platform is the part that is often missed. A warehouse can clean up old data, but if new data still arrives by email, the problem returns.
How did this work for KMÍ?
KMÍ is an Icelandic government body that manages grants and reimbursements. Together with Móholt, we built both halves.
The grants intelligence warehouse. Data had been spread across several legacy systems, and reporting was slow and inconsistent. KMÍ also needed grant analysis by gender to meet policy and transparency requirements. We built a central data warehouse for grants, reimbursements and demographic data, fed by automated ETL pipelines. On top sit four Qlik Sense dashboards:
- Grants: by type, region and demographic indicators.
- Reimbursements: processing times, time to disbursement and totals by category.
- Policy insights: gender-based analysis of grant allocation.
- Financial reporting: overviews for internal and external audits.
Report generation went from days to minutes.
The project platform. Existing processes were manual and data was siloed, which limited visibility of project status and financial figures. We built a full-stack platform in React, Node.js and PostgreSQL where authorised users enter and edit projects and grants. It has role-based access, live status views for grant allocations and reimbursements, and embedded Qlik Sense Enterprise dashboards with drill-downs. The work ran as one month of requirements and design, four months of development and testing, and one month of deployment and training.
How do you handle access and audit?
Public data comes with obligations. A few rules we build in from the start:
- Role-based access. Staff see what their role needs. Applicant details are not visible to everyone who can open a summary report.
- Data protection. Iceland applies the GDPR through Act no. 90/2018. Personal data in grants, such as names and demographic fields, needs a clear purpose and limited access.
- Validation and monitoring. Checks on every load catch missing records and odd values before they reach a dashboard.
- An audit trail. The financial reporting views exist so that internal and external auditors can see where figures come from.
None of this is extra work at the end. It shapes the data model from the first week.
What about procurement?
Public bodies in Iceland buy under the Public Procurement Act no. 120/2016. Central procurement used to sit with Ríkiskaup. On 1 August 2024 its tasks and staff moved to Fjársýsla ríkisins, and Ríkiskaup was abolished. If you are planning a data project, check the current procurement route with your own procurement contact before you write the brief.
Where should a public body start?
A first phase usually takes a few weeks and focuses on one area:
- Pick the report that takes the longest to produce today.
- Map every source behind it, and who owns each one.
- Agree definitions with finance and the programme team.
- Rebuild that report on a small warehouse and use it in the next reporting cycle.
From there, add a data entry platform where manual processes cause the most errors.
If you work in the public sector and want reporting you can reproduce, our analytics work and our software work show how we build it, and you can tell us about your setup.