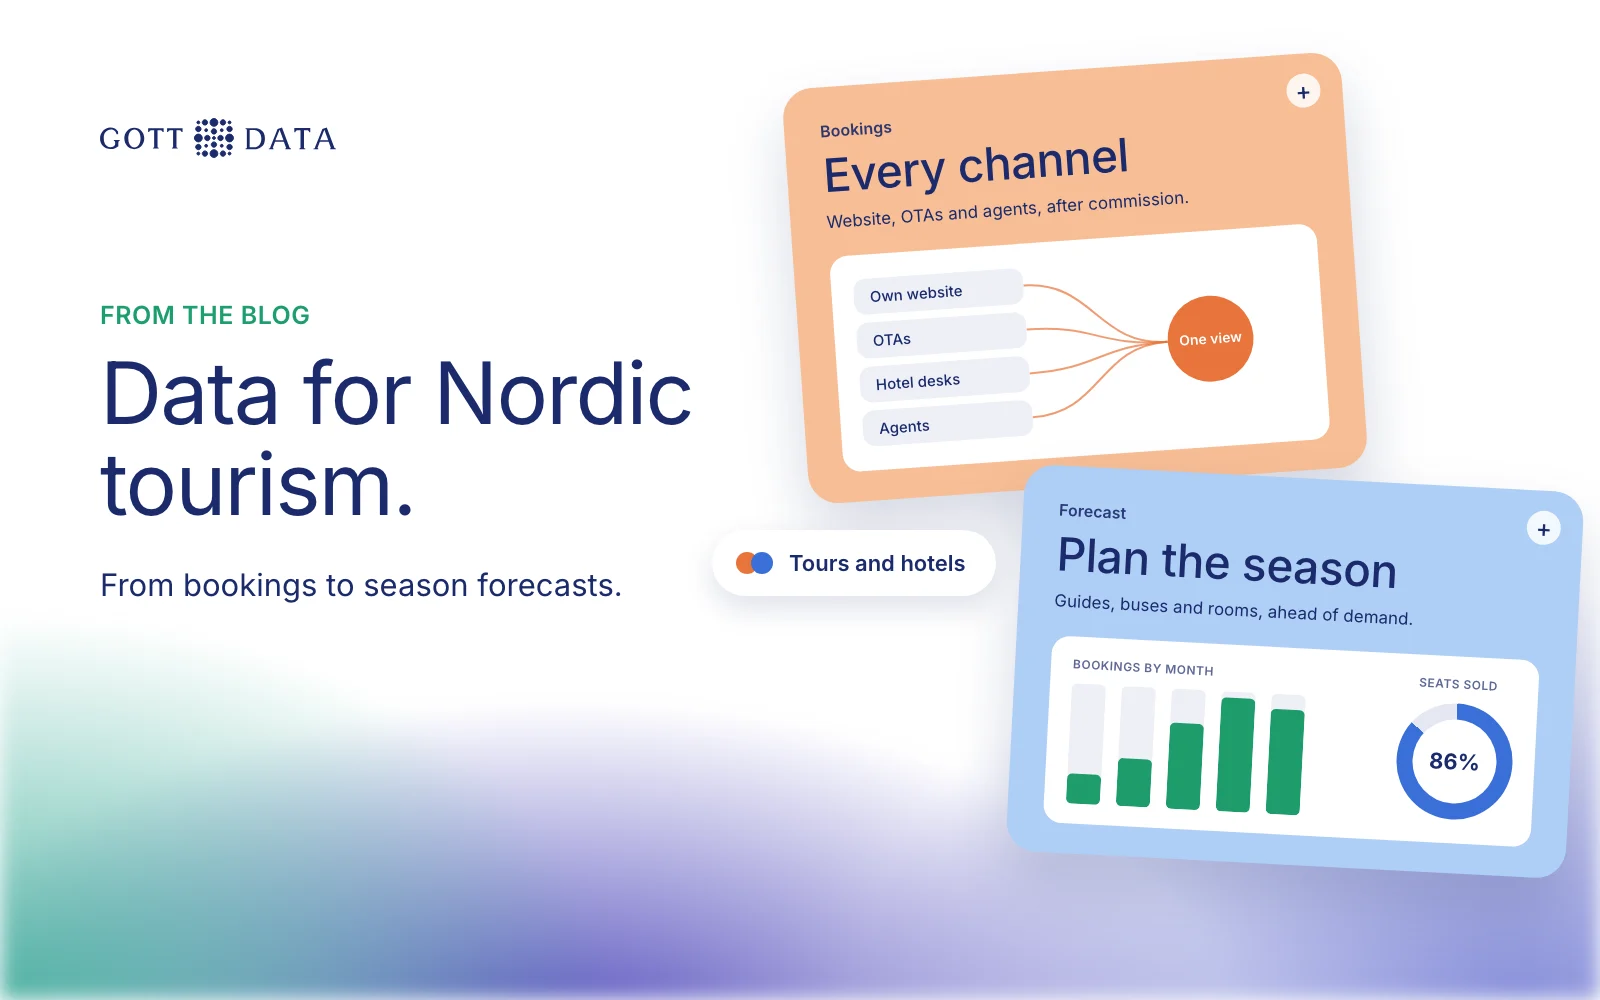
A tourism data consultancy helps tour operators, hotels and destination organisations turn bookings, costs and public statistics into decisions. Dashboards are the visible part. The real work is joining every sales channel into one view of margin, forecasting demand for the season, and setting prices and staffing ahead of it. This post covers what that work looks like for Nordic tourism businesses, and which public Icelandic data is worth adding.
What does a tourism data consultancy do beyond dashboards?
Most tourism businesses already have reports. The booking system has one, each OTA has one, and accounting has its own. The trouble is that none of them agree, and none of them look ahead.
A consultancy's job is to fix both problems. In practice that covers four areas:
- Channel margin: what each sale earns after commission, across every channel.
- Demand forecasting: expected bookings per product and week for the coming season.
- Capacity and staffing: guides, vehicles and rooms planned against that forecast.
- Pricing: when to hold a price, when to raise it and when to open more capacity.
Each area builds on the one before. A forecast is only as good as the booking history behind it.
Why start with channel margin?
Because it changes decisions the fastest. A tour sold through an OTA, a hotel desk and your own website can bring in very different revenue for the same seat. Once every booking carries its real net revenue, the questions get simple. Which channel brings the best yield? Which tours lose money after commission? Which reseller deserves more allocation next season?
We wrote a separate guide on tour operator data analytics that covers the booking, cost and ETL side in detail.
How do you forecast demand for the season?
Nordic tourism has sharp seasons, and decisions about hiring and fleet are made months ahead. A forecast helps by turning history into a range of expected bookings for each week.
A useful forecast draws on three kinds of data:
- Your own bookings, by booking date and travel date, so you can see how far ahead each market books.
- Capacity: seats, rooms or vehicles offered, so you can tell weak demand from sold-out days.
- Outside signals: arrivals and overnight stays in the country, which show the wider trend.
The output should be a range, not one number. A made-up example: "between 380 and 450 seats in week 28" is easier to plan around than a single figure that will be wrong. Review it each month and compare it with what actually happened.
Which public tourism data can you use in Iceland?
Two public bodies publish data that fits well beside your own.
The Icelandic Tourist Board (Ferðamálastofa) publishes counts of departing passengers at Keflavík airport by nationality. The counts come from a year-round sample survey, so they are estimates. Monthly tables are updated each month. Main nationalities go back to 2002, and a table with all nationalities starts in 2017. The board also runs a tourism dashboard, Mælaborð ferðaþjónustunnar.
Statistics Iceland (Hagstofa) publishes tourism statistics from monthly data collected from accommodation providers. These cover capacity, occupancy, guest arrivals and overnight stays, by type of accommodation, region and nationality. It also publishes annual tourism satellite accounts.
Joined with your own bookings, these answer useful questions. Is a slow month weak for you, or for the whole market? Which nationalities are growing, and do your channels reach them? Which regions are filling up first?
What did this look like for TourDesk?
TourDesk connects hotels with tours and excursions from many vendors. Its data sat in separate systems for hotels, vendors, suppliers, car rentals, restaurants and bookings. That made it hard to see customer behaviour or regional trends.
We built automated ETL pipelines into one governed source of truth, with GDPR standards built in. On top sit role-specific Qlik Sense dashboards for bookings, revenue, customer behaviour and regional performance, with incremental loads for near real-time reporting. The full story is in the TourDesk case study.
Where should you start?
Start small and use the result in a real meeting:
- Connect your booking system and your largest sales channel.
- Agree how revenue, cancellations and travel dates are counted.
- Build one view of net revenue by channel and month.
- Add public data and a first forecast once the history is clean.
You can try a working example in our live tourism demo. When you want the same view of your own business, our analytics work shows how we build it, or you can book a call.