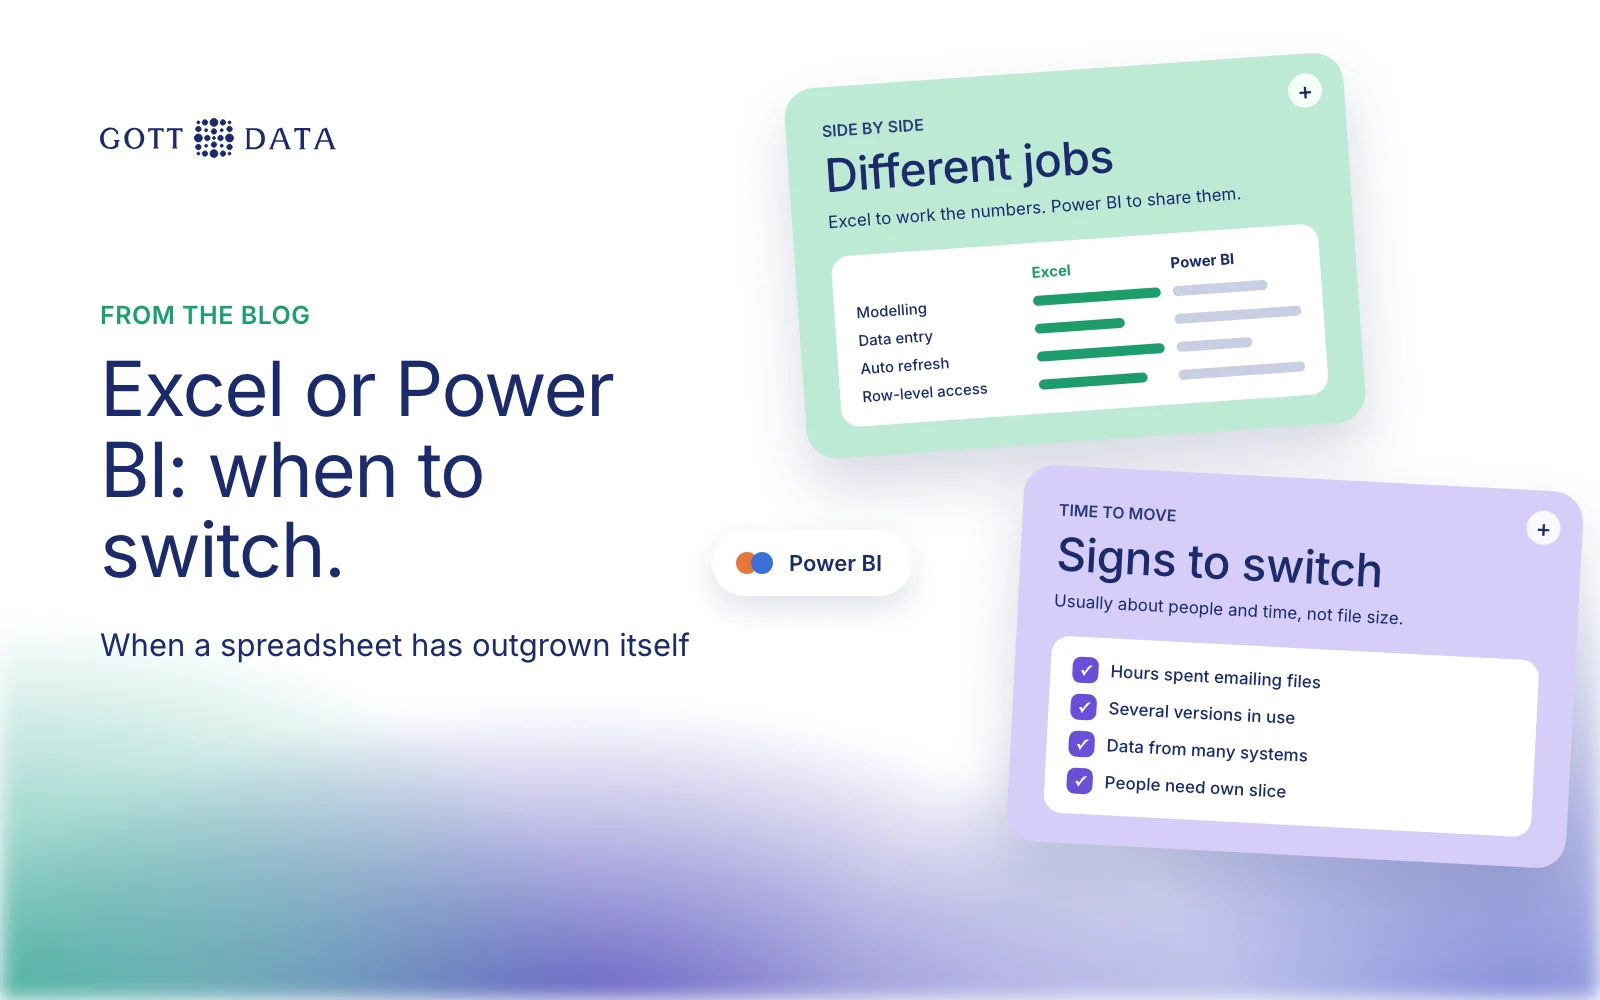
Power BI vs Excel is less of a contest than it looks. Excel is the better tool for working with numbers: models, budgets, one-off analysis and anything people need to type into. Power BI is the better tool for sharing the same numbers with many people, refreshed on a schedule, with each person seeing only their own slice. Most companies need both. The real question is when a spreadsheet report has outgrown Excel, and how to move it without breaking it.
What do Excel and Power BI have in common?
More than people expect. Both use Power Query to get and clean data. Microsoft's Power Query overview lists it in Excel for Windows, Excel for Mac and Power BI. The transformations you build are written in the same M language.
Both can also use DAX. Microsoft's DAX overview says DAX is used in Analysis Services, Power BI and Power Pivot in Excel. So an analyst who has built a Power Pivot model in Excel already knows much of what Power BI asks for.
Power BI vs Excel: the main differences
| Excel | Power BI | |
|---|---|---|
| Best at | Calculation, modelling, data entry | Sharing interactive reports |
| Worksheet size | 1,048,576 rows by 16,384 columns | No worksheet; data sits in a model |
| Refresh | Manual, or by code | Scheduled in the Power BI service |
| Sharing | Send or store the file | Publish once, people open it in a browser |
| Access control | File or sheet permissions | Row-level security per role |
Some notes on the table. The worksheet limit comes from Microsoft's Excel specifications. Excel's Data Model can hold more than a sheet, and in 64-bit Excel it is limited by memory rather than a fixed size. On refresh, Microsoft's refresh documentation gives eight scheduled refreshes a day on shared capacity and up to 48 on Premium, PPU or Fabric capacity. On security, the DAX overview notes that row-level security is not available in Power Pivot in Excel. On cost, Power BI Desktop is free, but sharing reports needs a paid licence such as Pro.
When is Excel enough?
Keep it in Excel when:
- one person or a small group builds and reads the report,
- the data changes weekly or monthly, not daily,
- people need to type in numbers, such as a budget or a forecast,
- the analysis is a one-off,
- or the report is a financial model where every cell needs to be visible and checkable.
Excel is also the right tool for a first version. Building a report in a spreadsheet is a fast way to find out which numbers people actually want.
When should you move to Power BI?
The signs are usually about people and time, not file size:
- Someone spends hours each week refreshing, copying and emailing the same workbook.
- Several versions are in circulation, and meetings start with "which file is right?"
- Different people should see different data, such as each manager seeing only their own region.
- The data comes from several systems and needs joining every time.
- People want to filter and drill down without asking the author for a new tab.
- The workbook is slow, with lookups across tens of thousands of rows.
If two or three of these are true, a Power BI report is usually worth the effort.
How to migrate an Excel report to Power BI, step by step
- Write down what the report answers. List the five or six numbers people look at, and how each is calculated. Hidden formulas are where most surprises come from.
- Find the real sources. Trace each sheet back to the system it came from. Connect Power BI to those sources, not to the old workbook, wherever you can.
- Reuse your Power Query steps. If the workbook already uses Power Query, the queries can often be copied across with few changes.
- Build a simple model. Split the data into fact tables (sales, bookings) and dimension tables (dates, products, customers). Microsoft's star schema guidance explains why this keeps reports fast.
- Rewrite formulas as DAX measures. A cell formula becomes a measure that works in every visual and filter.
- Check the numbers. Put the Excel and Power BI totals side by side for the same period until they match.
- Publish and set the refresh. Add a gateway if the data sits on your own servers.
- Retire the workbook. Tell people where the new report is, and stop sending the old file.
Keep Excel in the loop. Many teams still export from Power BI to Excel for ad hoc work, and that is fine.
If your reports have outgrown their spreadsheets, our analytics work shows how we build Power BI models and dashboards, and the retail demo shows what a joined-up dashboard looks like.