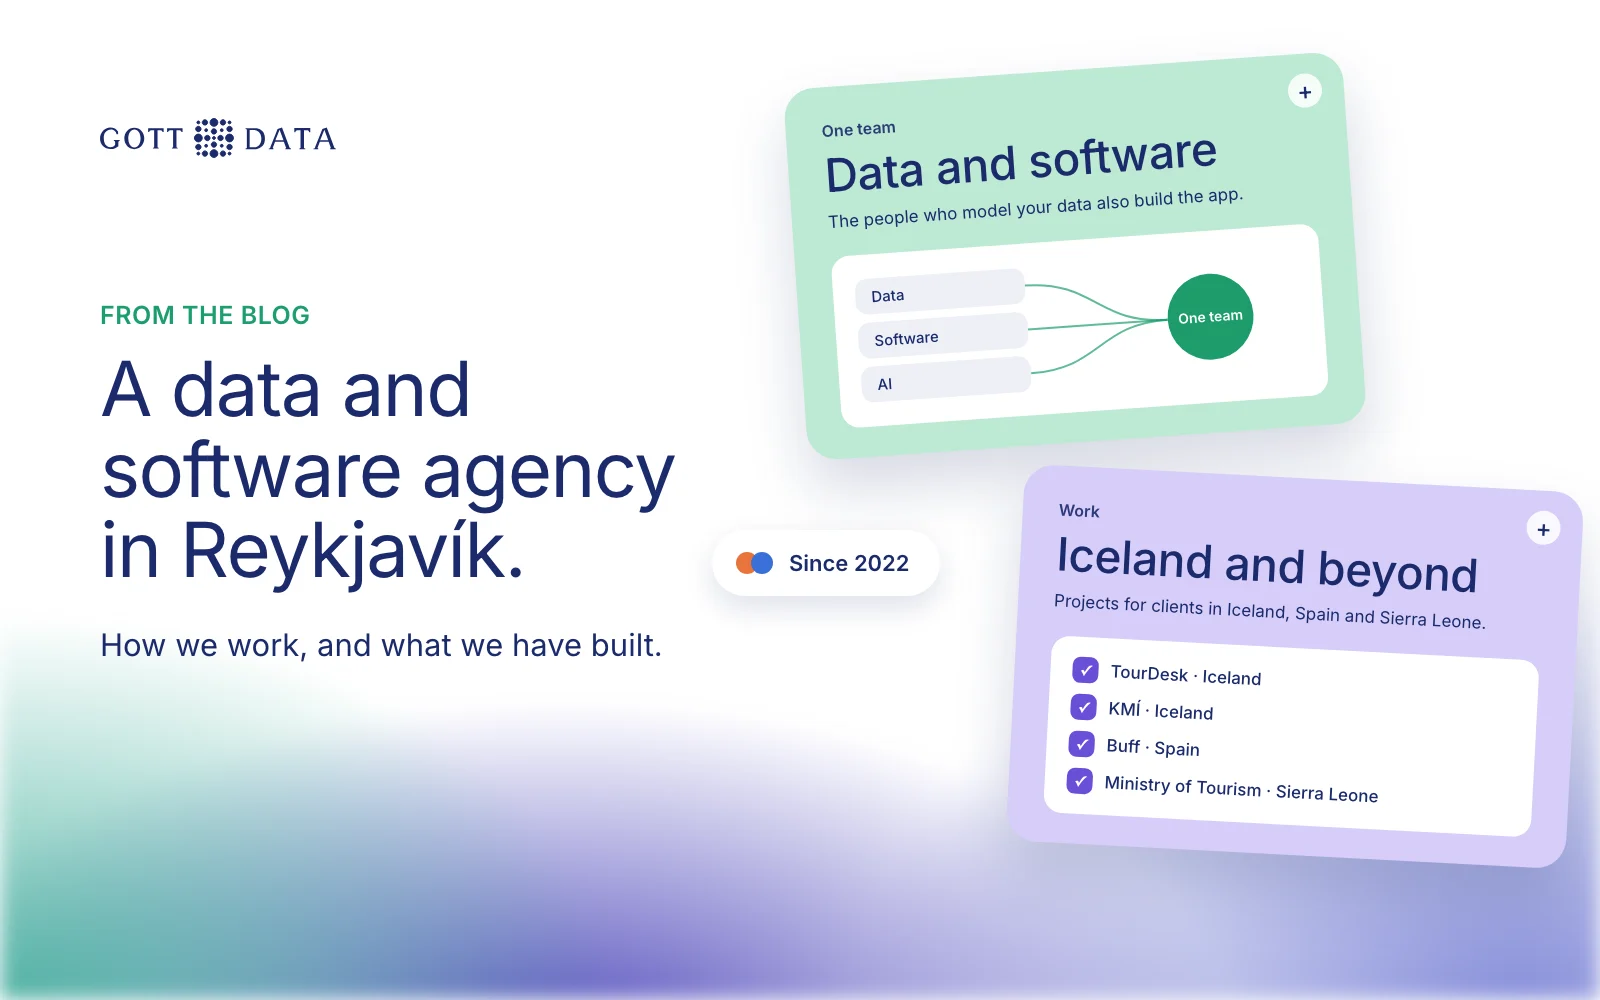
Gott Data is a data and software agency in Reykjavík. We build data warehouses and ETL pipelines, BI dashboards in Qlik Sense and Power BI, machine learning models and bespoke software, and the same team does all of it. We were founded in 2022, and the legal entity is Laxatunga ehf. We work mainly for SMEs and the public sector. This post explains what we do, how a project runs, and what we have built so far.
Who are we?
We started in Reykjavík in 2022 with one aim: to make data work for small and medium-sized companies and public bodies. The name is Icelandic-English for "good data".
Most of our clients come to us with one of two problems. Their numbers live in too many places and nobody trusts them. Or they have an idea for a tool that needs both data and an app to work. We handle both, often in the same project.
We also work with partners. With Móholt we have delivered projects for KMÍ, an Icelandic government entity. With CloudTech we built recommendation models for CorEnroll.
What does one data and software team mean for you?
In many projects the data work and the software work are bought from different suppliers. One firm builds the warehouse. Another builds the app that should use it. The gap between them is where projects slow down.
We keep both in one team. In practice that means:
- The people who model your data also build the app. No handover document between two companies.
- Fewer meetings. You explain the problem once, to the people who will solve it.
- One owner for the whole flow. From the source system, through the pipeline, to the dashboard or screen your staff use.
- Machine learning in the same place. A model is only useful if it reaches a screen someone looks at, so we build that part too.
How does a project run?
We follow the same six stages on every project, whether it is a dashboard, a model or a full product.
- Understand the human story. We talk to the people who will use what we build and find one clear question worth answering.
- Assess where you stand. We check data maturity, data quality and readiness for AI, and point out quick wins.
- Design around the decisions people make. Then we choose the data, models and tools that serve them.
- Build a viable solution. Real data and real users, running in your environment from the start, built to be handed over.
- Improve with your feedback. We measure it against what we agreed and fix what does not work.
- Keep it going. New data, better models, more of your team using it, and the system kept healthy.
Some clients arrive at stage one with a question. Others come at stage four with something half built. We start where you are. The approach page has more detail on each stage.
What have we built?
Our work so far covers Iceland, Spain and Sierra Leone. A few examples:
- TourDesk, Iceland. Hotels, vendors, bookings and car rentals joined into one governed source of truth, with Qlik Sense dashboards on top. See the TourDesk case study.
- KMÍ, Iceland, with Móholt. A central data warehouse and Qlik Sense dashboards for grants and reimbursements, plus a project platform for entering and tracking public projects. See the KMÍ grants case study.
- Original Buff, Spain. A predictive maintenance model that flags machine failures before they happen, so the maintenance team fixes the critical machines first.
- CorEnroll, with CloudTech. Recommendation models that put the right product in front of each customer, trained, deployed and monitored end to end.
- Ministry of Tourism, Sierra Leone. The investor campaign for three eco-tourism sites under the World Bank SLEDP programme: the website, outreach to 40,000 investors, a live government webinar and matchmaking.
We also build our own products. Quantile is a chat-first analytics workbench: ask a question and get an editable pipeline from extract to chart. You can try it at demo.gottdata.com.
How do you start working with us?
Start with a short conversation about what you want to fix. It helps to bring three things:
- The systems that hold the data you care about.
- The question you can't answer today, or the tool you wish you had.
- Who in your team would use the result.
From there we suggest a first step that is small enough to finish in a few weeks. You can read more about us, or book a call and tell us where you are.